Real User Monitoring is becoming increasingly common. The success of a business largely depends on the user experience. With monitoring, we can easily influence these experiences by ensuring they are as optimal as possible, fostering smooth cooperation, and avoiding the risk of losing customers, which could significantly impact financial results.
What is Real User Monitoring (RUM) and Why Does It Matter?
Real User Monitoring (RUM) is a tool that helps understand customers by analyzing interactions and the performance of applications in real time. The analysis involves observing user activities — the types of actions, the duration of those actions, and their impact on application performance. Real-time observation also makes it easy to detect emerging issues, errors, and performance drops. This tool also allows monitoring user behavior, so we can track how many users choose to return.
Session Replay as a key element of RUM
The fundamental concepts of Real User Monitoring (RUM) focus on user sessions and their actions. In the context of web applications, a user session is a crucial element in tracking interactions and behaviors on a website. By analyzing sessions, we can understand how long a user stays on a page, which pages they visit, what elements they click, and how they navigate through the site.
Sessions can vary significantly between users. Session replay enables the collection and analysis of all this data, providing insights into where improvements can be made. UX designers can use this data to better understand how users interact with the app and how developers can improve the interface.
Main functions of Session Replay:
- Tracking user behavior: The tool records various user interactions, such as clicks, page scrolling, data input into forms, changes on the page (e.g., opening menus, navigating between subpages), and errors or issues that may arise during site usage.
- Identifying UX issues and errors: Through session replay, you can identify user difficulties related to the interface (e.g., non-intuitive elements, slow page load times, form errors) and observe where users might encounter issues or abandon further interaction.
- Adapting to different devices and platforms: Session replay tools allow tracking user interactions on different devices (desktop computers, mobile devices) and browsers, enabling detailed analysis of performance and user experience across various platforms.
- Reconstructing user sessions: Session replay records user interactions in real time and allows for later playback, offering a detailed analysis of how the user behaved on the site.
- Visual analysis: The recreated user session is typically displayed as a recording, similar to a video, showing how the user navigated the site. This can include visual interactions (e.g., clicks, navigation) and changes in the site’s appearance (e.g., loading new content).
- Measuring performance: Tracking webpage load times, server response times, and relevant metrics such as Time to First Byte (TTFB), First Contentful Paint (FCP), Largest Contentful Paint (LCP), and First Input Delay (FID).
By using session replay, you can significantly optimize user experiences through aggregation and analysis of site interactions. This enables improvements in interface design, site navigation, identification of performance issues, JavaScript errors, broken links, server problems, script behavior, and testing of new functionalities.
How to start using Real User Monitoring?
Now that we understand how important RUM is and the benefits it brings, we should focus on selecting a tool. Each RUM tool has its own integration method.
To begin monitoring real users, you need to inject JavaScript code into your application that will capture metrics during its operation. Properly prepared code can track page loading, XHR requests, and capture metrics during user actions.
Key Real User Monitoring Metrics to Track Performance
The most important RUM metrics monitored in real time include:
- Connection Requests – These define the total number of HTTP requests sent to the server to fetch resources.
Active Users – This indicates the number of active connections to the website over a specific period of time. - Bounce Rate – This metric shows the percentage of users who leave the website directly after it has loaded.
- Page Load Time – This is the average time it takes for a webpage to load and display in the user’s browser. RUM tools allow for displaying real load times, considering filters such as user location, browser type, or device.
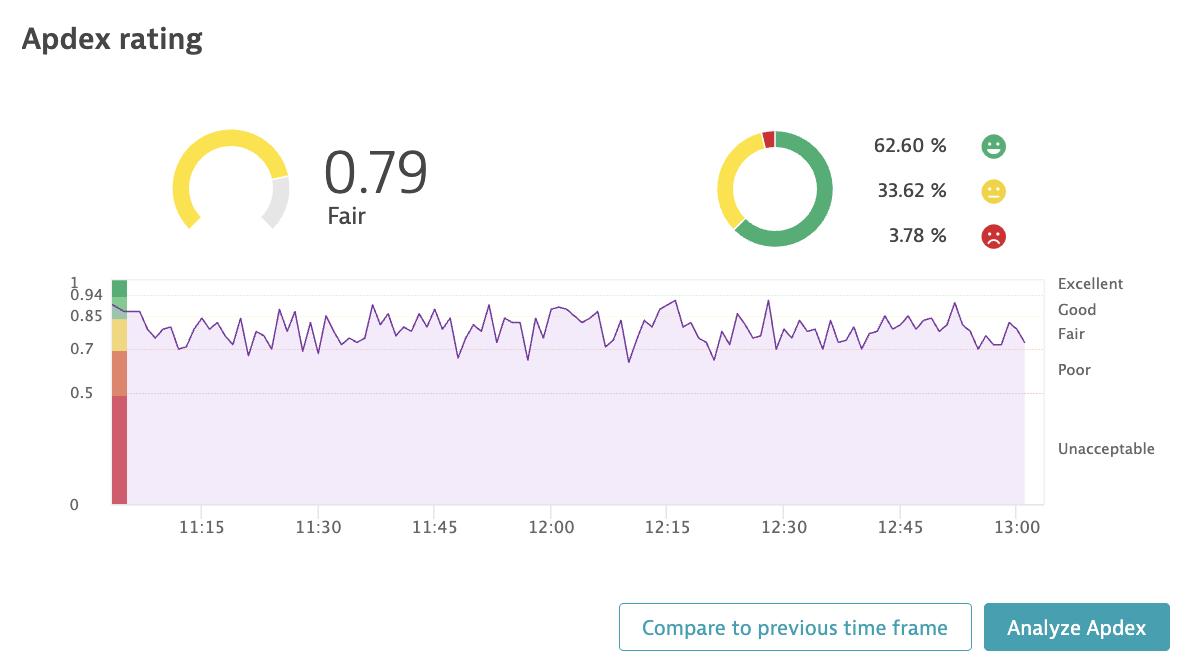
- User Satisfaction Index (Apdex) – Apdex is a numerical score that represents the level of user satisfaction with the performance of the web application.
These metrics help in understanding the overall performance of your website and how real users interact with it. By tracking them, you can gain actionable insights into potential improvements.
Real User Monitoring Limitations
Unfortunately, Real User Monitoring also has some limitations that are important to be aware of when starting to use it. It may happen that the injected JS code negatively impacts the application's performance, causing delays in its loading. Additionally, RUM is not suitable for low-traffic websites, as insufficient data can distort analysis and conclusions.
It is also crucial that the data is processed in a way that respects user privacy. For proper functioning, the user must have JavaScript enabled in their browser. Otherwise, some interactions may not be recorded. RUM provides information about client-side performance (e.g., page load time, user actions), but it does not always capture server-side issues, such as database errors or server problems. To fully understand performance, server-side monitoring is also necessary. Sometimes, RUM generates large volumes of data, which can be overwhelming during analysis.
Despite these limitations, RUM remains a very useful tool providing valuable insights. However, it is advisable to combine it with other monitoring tools and a thorough understanding of the data it collects.
Real User Monitoring and Session Replay Tools
Below is a table showing the most important tools supporting RUM and Session Replay, along with their main features and purpose.
| Tool | Description |
|---|---|
| Dynatrace | Dynatrace offers highly advanced user experience monitoring by combining RUM data with backend analysis and infrastructure insights. Session Replay enables precise re-creation of user behavior and correlates it with performance metrics and application errors. |
| Datadog | Datadog allows tracking of real user interactions and has recently introduced a Session Replay feature. Both features are tightly integrated with logging, tracing, and infrastructure monitoring, allowing for quick root cause identification. |
| New Relic | New Relic provides strong support for RUM along with the ability to record user sessions via a separate module. The system facilitates analysis of the impact of frontend issues on conversion and other business metrics. |
| Splunk RUM | Splunk focuses on RUM and its integration with logs and infrastructure data. It does not offer native Session Replay, so it is primarily used for performance and technical error analysis. |
| Contentsquare | Contentsquare is a tool dedicated to UX and user behavior analysis. It provides both RUM data and an extensive Session Replay feature, with a strong focus on conversion optimization and user experience. |
| FullStory | FullStory specializes in user experience analysis and offers high-quality session recordings enriched with technical context. The tool is frequently used by product and UX teams to analyze interfaces and improve usability. |
| Hotjar | Hotjar mainly offers Session Replay, heatmaps, and surveys, but does not provide full RUM capabilities. It is well-suited for simple tracking of user behavior at the interface level. |
| LogRocket | LogRocket focuses on the frontend and enables monitoring of real users as well as accurate session replay. It supports analysis of JavaScript errors, user interactions, and the impact of issues on the end user. |
| Smartlook | Smartlook provides session recordings and real-time data on actual user interactions. While it lacks advanced backend monitoring, it excels at analyzing user journeys and UI errors. |
| Mouseflow | Mouseflow is exclusively focused on capturing user behavior such as clicks, scrolling, form inputs, and navigation paths. It does not offer full performance monitoring but serves as a solid support tool for UX analysis. |
As you can see, there are many tools available that support RUM and Session Replay. However, each has a different purpose. If you're working on DevOps or performance, choose Dynatrace, Datadog, or New Relic for their strong integration with the backend, logs, tracing, and alerts. However, if you want to monitor product development (e.g., an application or online store), FullStory or LogRocket are better choices due to their better understanding of user paths, website behavior, session replays, and heatmaps.
A Practical Example of Application Monitoring with Dynatrace
To get started using Dynatrace, you need very little. Add the following code to the JavaScript section of your page:
<script src="https://{YOUR_ENVIRONMENT_ID}.live.dynatrace.com/jstag/loader.js" async></script>
{YOUR_ENVIRONMENT_ID} is the unique identifier for your Dynatrace environment (e.g., abc12def3456g7h8i9j0klmnopqrs), which you can find in the Dynatrace dashboard after creating an account and creating a monitoring application.
This script automatically collects metrics from your website: load time, JS errors, clicks, navigation, etc. The data is sent to Dynatrace, where you can analyze it in real time. In the dashboard, you can also customize the behavior of the RUM agent, such as enabling or disabling specific features (e.g., session replay or user action tracking). Once the configuration is complete, you can start enjoying access to extensive application metrics.
The user panel provides access to many useful features. The Applications tab presents a table with many useful filters summarizing all monitored applications with key metrics.
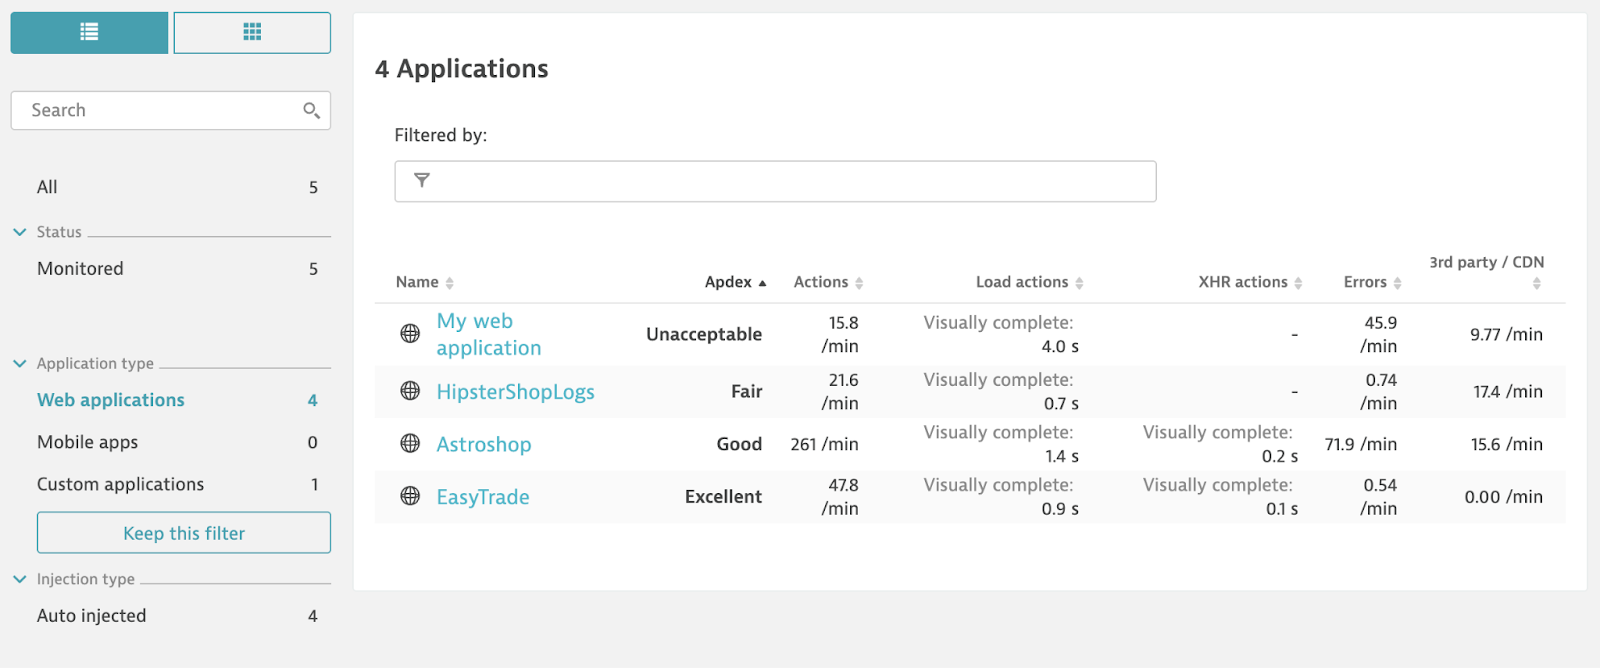
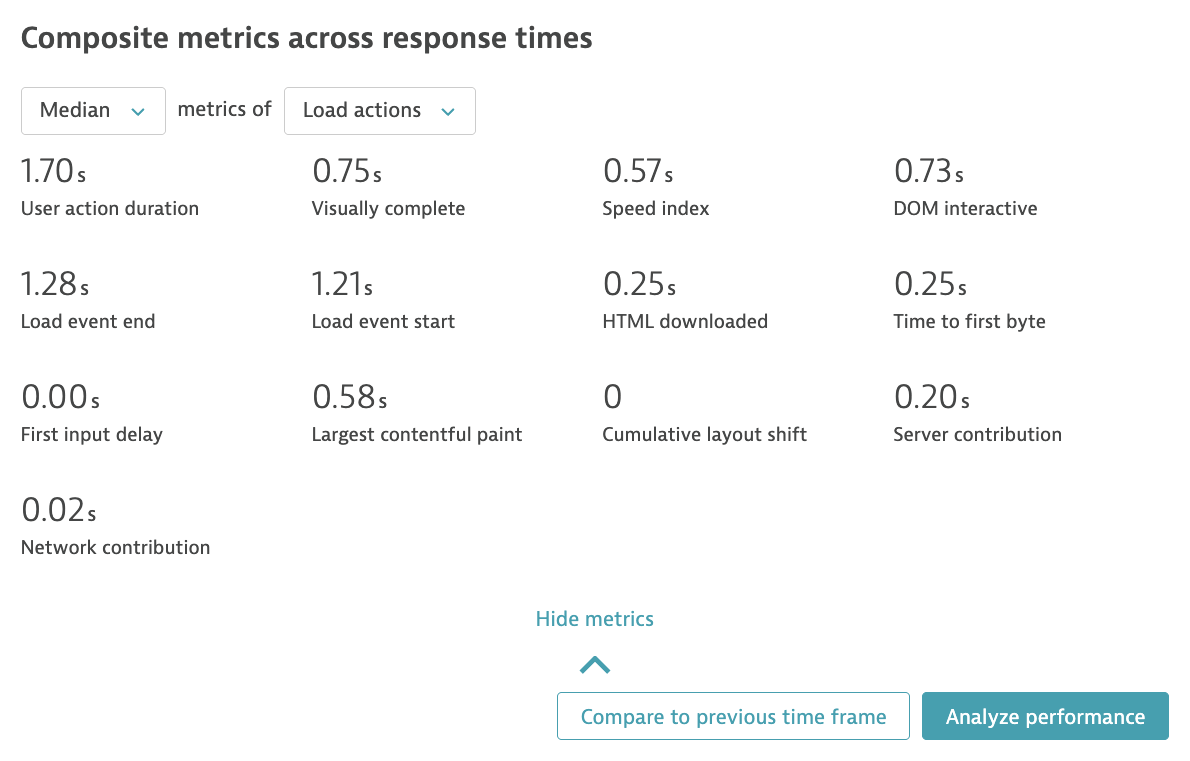
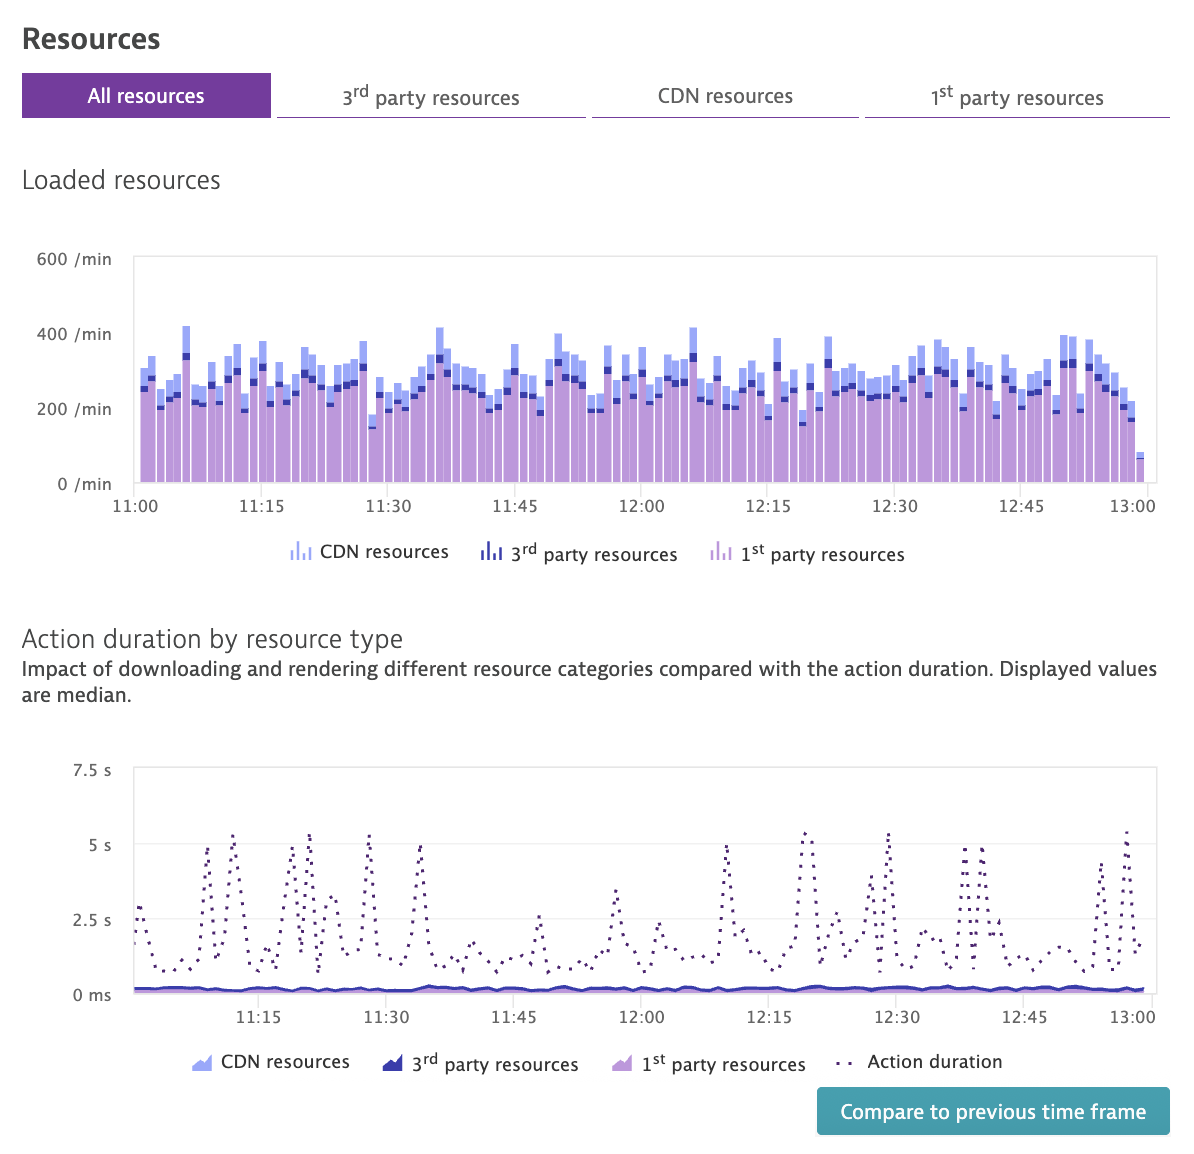
After selecting a specific application, the user is redirected to the main dashboard, which features a widget summarizing key data (Fig. 2). Next to it are sections presenting key errors (Fig. 3), detailed error widget (Fig. 4), and the impact of user actions on application performance (Fig. 5), summary of complex response time metrics (Fig. 6), apdex rating (Fig.7), loaded resources with action duration by resource type (Fig.8). Each widget has an expandable detailed view, enabling detailed analysis of issues and their context (Fig. 9, 10).

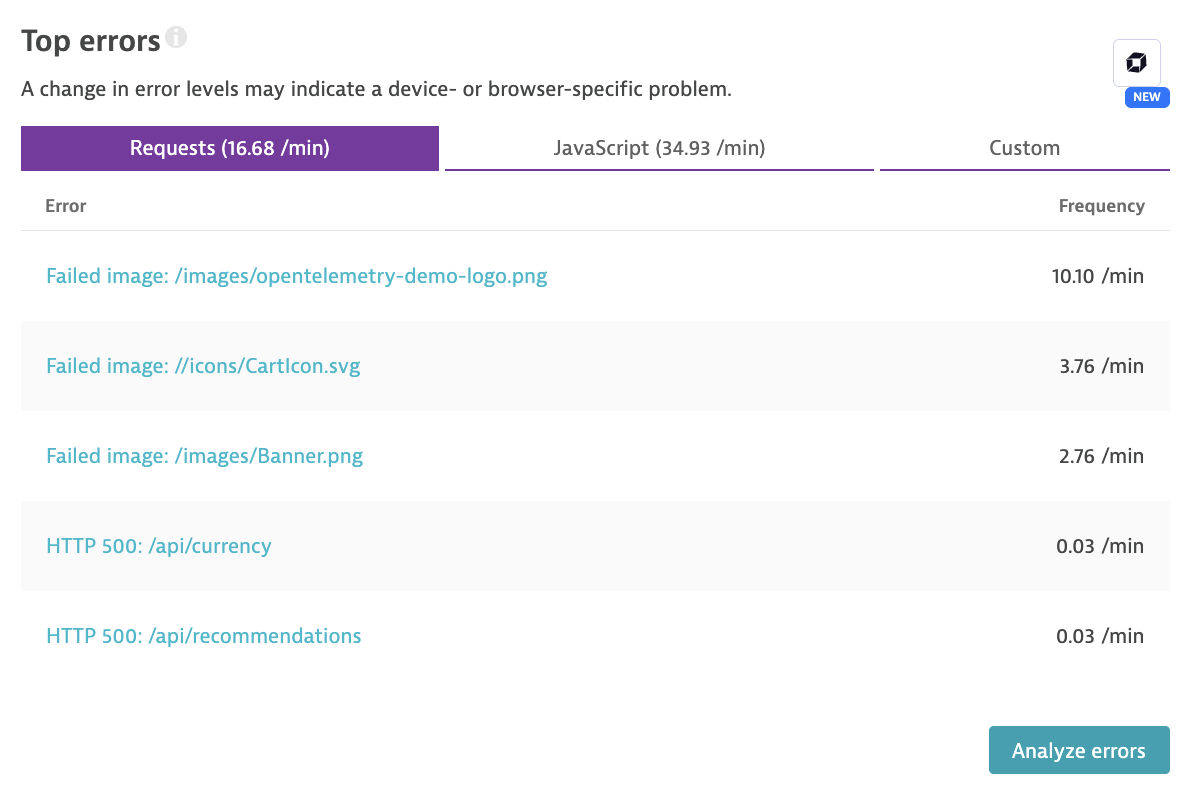
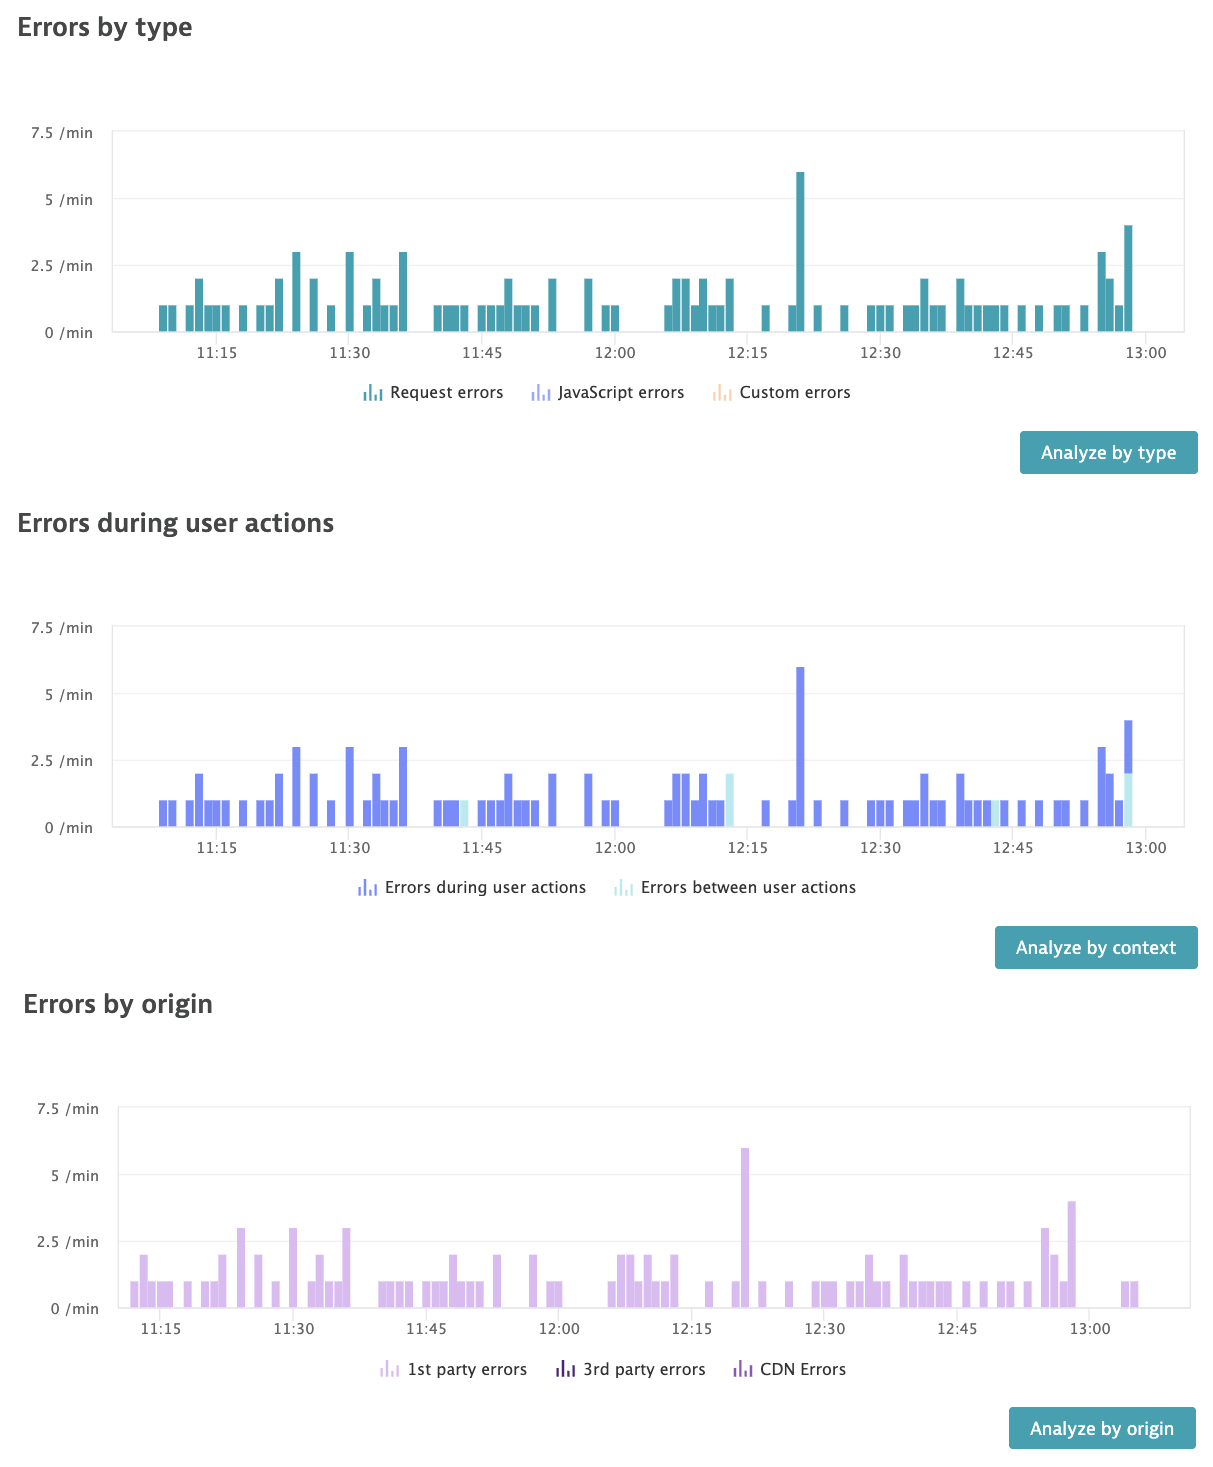
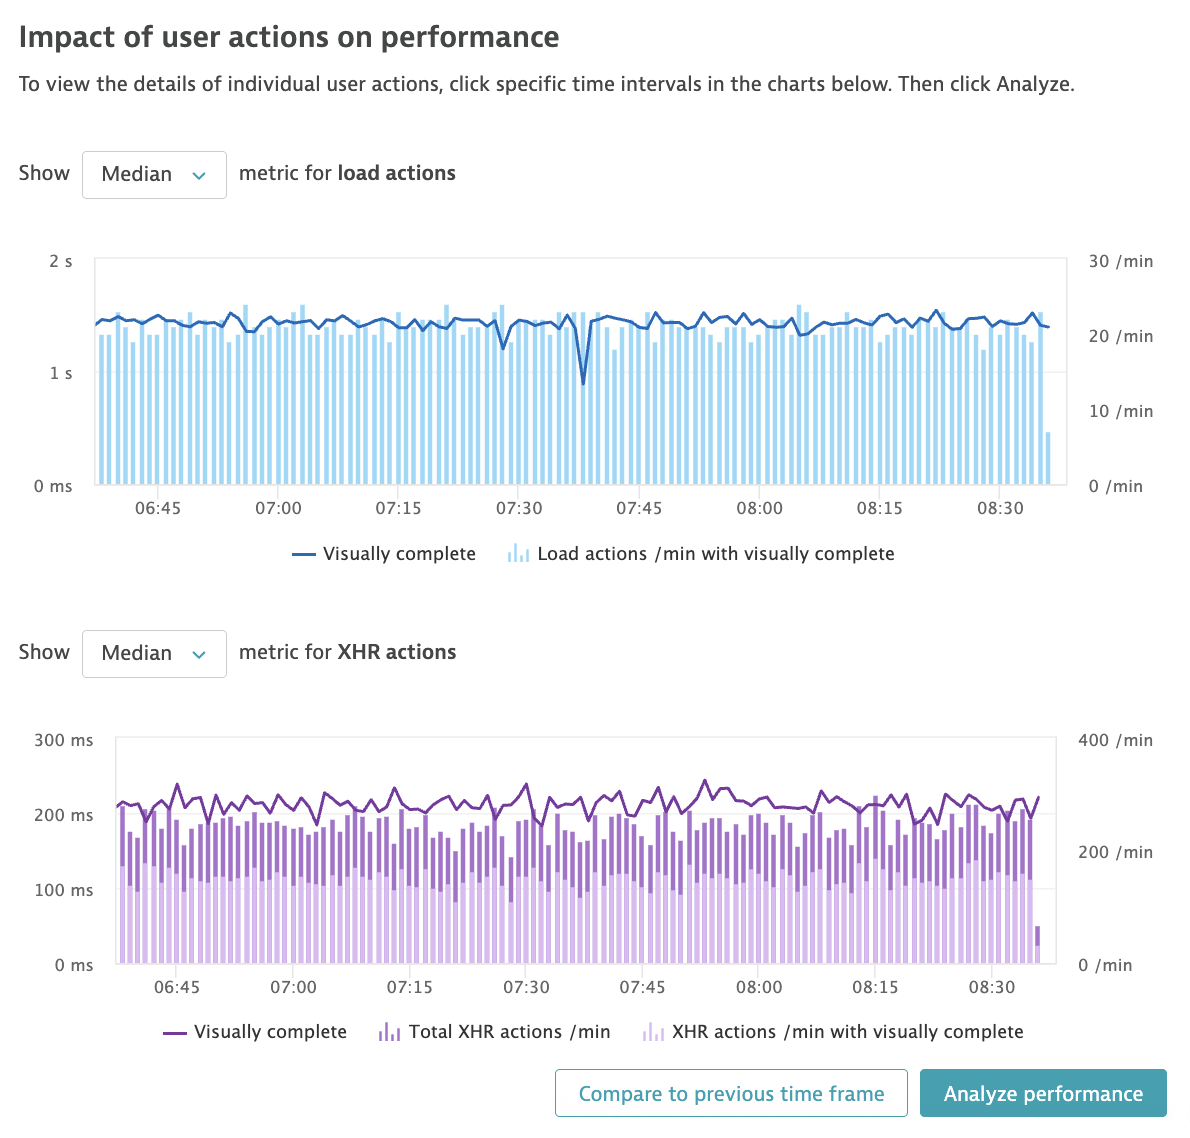


At the top of the main widget, there's an "Analyze user sessions" button (Fig.2.), which takes you to a view presenting a summary of user sessions. The data is presented in a table with extensive filtering options. Sessions can be filtered by application type, User Experience Score, errors and annoying events, conversions and bounces, returning and new users, and even by browser, internet service provider, operating system, and location.
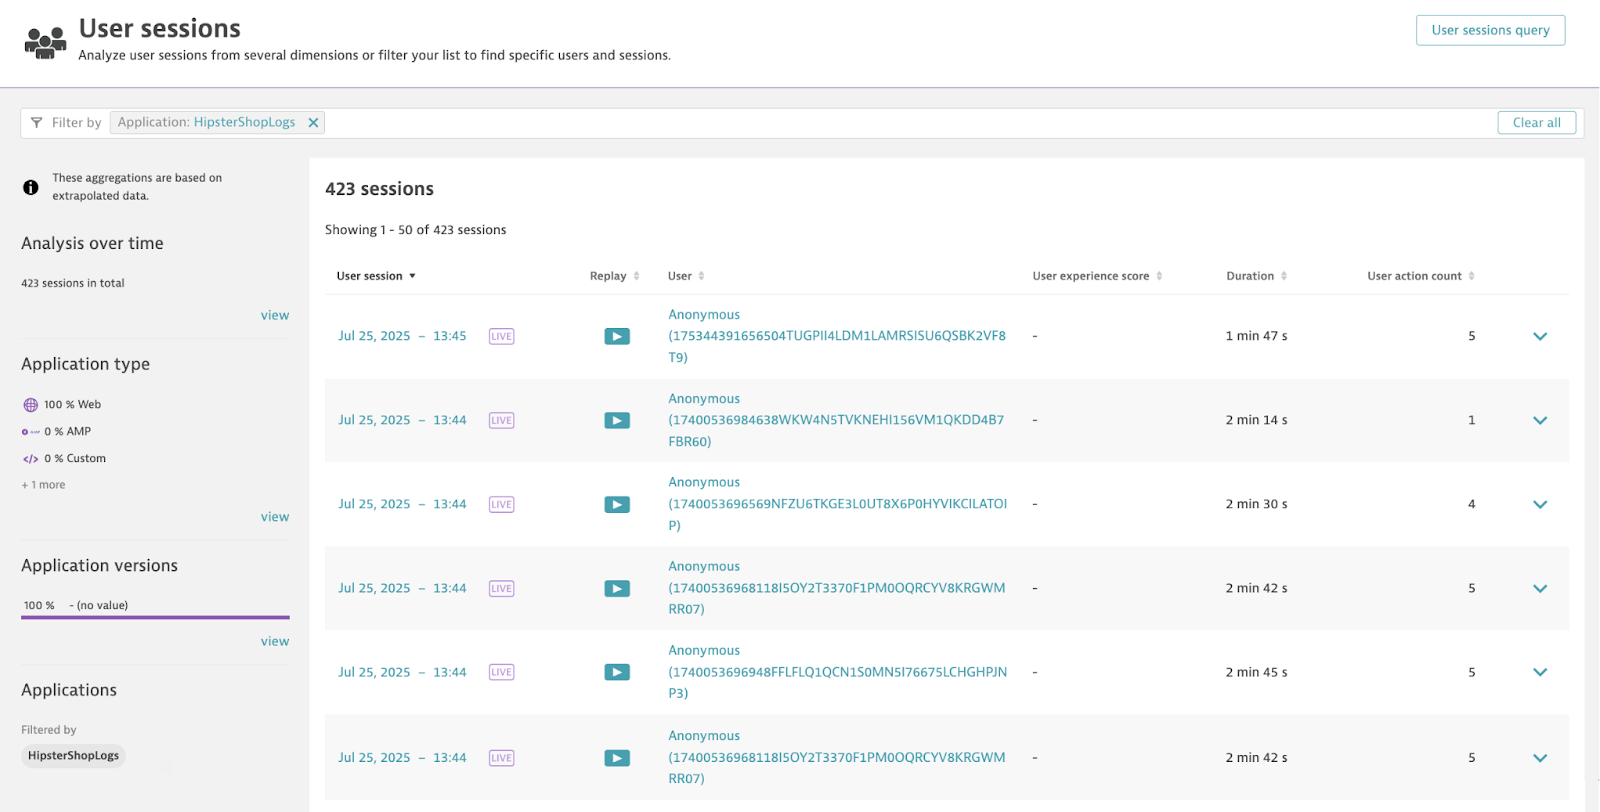
There are many options for filtering data, allowing you to quickly obtain all the information you need for session analysis.

The user sessions tab allows you to view detailed data for a single session or a table of all sessions. Additionally, various filtering options are available by app type, app version, user experience score, browser type, internet service provider, operating system, and location.
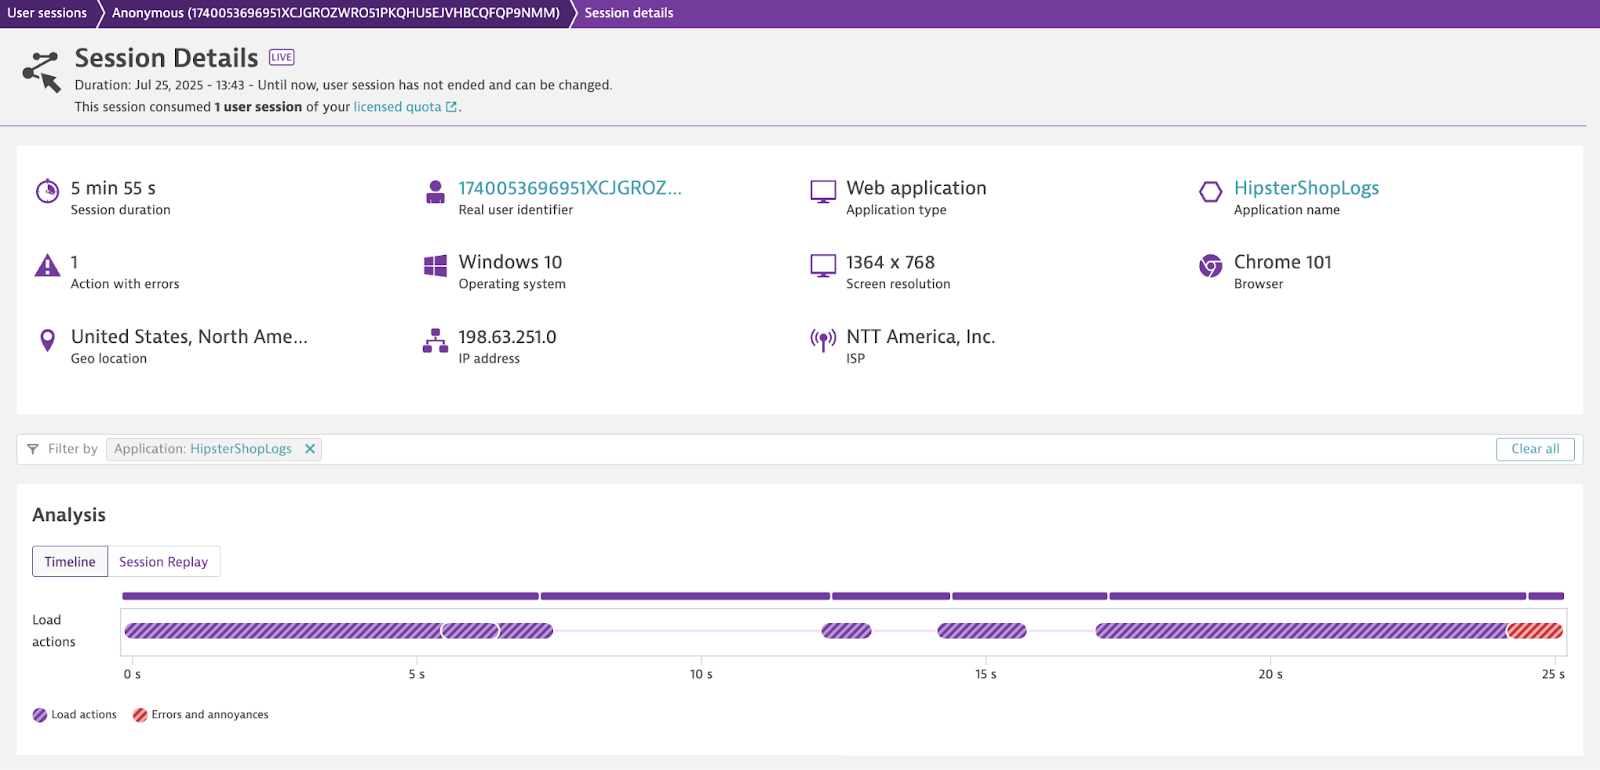
Based on the features presented, it's safe to say that Dynatrace is an exceptionally advanced tool, enabling comprehensive application monitoring. Due to its vast capabilities, it's impossible to cover all aspects in a single post. However, I hope this excerpt of functionality will encourage further exploration and potential practical use of this platform.
Summary
Real User Monitoring is becoming more and more prevalent as businesses recognize the crucial role user experience plays in their success. By using monitoring tools, we can directly influence these experiences, ensuring they are as optimal as possible. This helps promote smooth interactions and reduces the risk of losing customers, which could have a significant impact on financial performance.


