


Observability is a key part of modern cloud computing. OpenTelemetry helps by automatically keeping track of how different parts of your system communicate. Think of it like a dashboard for all your microservices. One standout feature? Auto-instrumentation. It does a lot of the setup work for you. But how do you use OpenTelemetry in Kubernetes? That's where the OpenTelemetry Operator comes in. It makes setting everything up in Kubernetes easy. In this post, we’ll introduce the OpenTelemetry Operator and show you a practical example of using its auto-instrumentation feature.

How it works: a glimpse into the OpenTelemetry Operator and OpenTelemetry Collector
At its core, the OpenTelemetry Operator streamlines the process of integrating observability into your Kubernetes applications. Here's a breakdown of what it does and how:
-
Management of OpenTelemetry Collector Deployments: The operator manages the deployment of OpenTelemetry Collectors, ensuring they run efficiently in your cluster.
-
Auto-Instrumentation: This is where the magic happens. For applications running in the cluster, the operator automates the instrumentation process. How? By injecting sidecars or init containers into deployments. This means less manual work for you and seamless integration for popular services like .NET, Java, Node.js, Go, nginx, and Python.
-
Extending Kubernetes API with custom resource definitions (CRDs):
- Instrumentation CRD: Handles the task of instrumenting applications within the cluster.
- OpenTelemetry Collector CRD: Oversees the various OpenTelemetry deployments in the ecosystem.
For a visual representation, take a peek at the following diagram:

Setting up OpenTelemetry Operator and managed Collector
In this section, we'll go step-by-step through the deployment of the OpenTelemetry Operator and the OpenTelemetry Collector it manages.
Create K8s cluster
We will need a K8s cluster. For our tutorial kind cluster will be good enough. To create one:
kind create cluster -n opentelemetry-operator
Deploying Cert-manager
The OpenTelemetry operator requires Cert-manager. Deploy it with:
kubectl apply -f
https://github.com/cert-manager/cert-manager/releases/download/v1.12.0/cert-manager.yaml
kubectl rollout status --watch --timeout=5m -n cert-manager \
    deployments/cert-manager \
    deployments/cert-manager-cainjector  \
    deployments/cert-manager-webhook
Installing the OpenTelemetry Operator
With Cert-manager in place, let's deploy the OpenTelemetry Operator:
kubectl apply -f https://github.com/open-telemetry/opentelemetry-operator/releases/latest/download/opentelemetry-operator.yaml
kubectl rollout status --watch --timeout=5m \
    -n opentelemetry-operator-system \
    deployments/opentelemetry-operator-controller-manager
Configuring and deploying the Collector
Now, it's time to define and deploy our OpenTelemetry Collector.
kubectl apply -f - <<EOF
apiVersion: opentelemetry.io/v1alpha1
kind: OpenTelemetryCollector
metadata:
  name: demo
spec:
  config: |
    receivers:
      otlp:
        protocols:
          grpc:
          http:
    processors:
      memory_limiter:
        check_interval: 1s
        limit_percentage: 75
        spike_limit_percentage: 15
      batch:
        send_batch_size: 10000
        timeout: 10s
    exporters:
      otlp:
        endpoint: jaeger-collector:4317
        tls:
          insecure: true
      logging:
    service:
      pipelines:
        traces:
          receivers: [otlp]
          processors: [memory_limiter, batch]
          exporters: [logging, otlp]
        metrics:
          receivers: [otlp]
          processors: [memory_limiter, batch]
          exporters: [logging]
        logs:
          receivers: [otlp]
          processors: [memory_limiter, batch]
          exporters: [logging]
EOF
Our OpenTelemetry Collector will collect traces in OTLP format and send them to the Jaeger ![]() platform. For testing purposes, it will be enough to deploy it from Jaeger all in one image.
platform. For testing purposes, it will be enough to deploy it from Jaeger all in one image.
kubectl apply -f - <<EOF
apiVersion: apps/v1
kind: Deployment
metadata:
  name: jaeger
  labels:
    app: jaeger
    app.kubernetes.io/name: jaeger
    app.kubernetes.io/component: all-in-one
spec:
  replicas: 1
  strategy:
    type: Recreate
  selector:
    matchLabels:
      app: jaeger
      app.kubernetes.io/name: jaeger
      app.kubernetes.io/component: all-in-one
  template:
    metadata:
      labels:
        app: jaeger
        app.kubernetes.io/name: jaeger
        app.kubernetes.io/component: all-in-one
      annotations:
        prometheus.io/scrape: "true"
        prometheus.io/port: "16686"
    spec:
      containers:
      - env:
        - name: COLLECTOR_OTLP_ENABLED
          value: "true"
        image: jaegertracing/all-in-one
        name: jaeger
        ports:
        - containerPort: 4317
          protocol: TCP
        - containerPort: 16686
          protocol: TCP
        readinessProbe:
          httpGet:
            path: "/"
            port: 14269
          initialDelaySeconds: 5
---
apiVersion: v1
kind: Service
metadata:
  name: jaeger-query
  labels:
    app: jaeger
    app.kubernetes.io/name: jaeger
    app.kubernetes.io/component: query
spec:
  ports:
    - name: query-http
      port: 80
      protocol: TCP
      targetPort: 16686
  selector:
    app.kubernetes.io/name: jaeger
    app.kubernetes.io/component: all-in-one
  type: LoadBalancer
---
apiVersion: v1
kind: Service
metadata:
  name: jaeger-collector
  labels:
    app: jaeger
    app.kubernetes.io/name: jaeger
    app.kubernetes.io/component: collector
spec:
  ports:
  - name: jaeger-collector-otlp-grpc
    port: 4317
    protocol: TCP
    targetPort: 4317
  selector:
    app.kubernetes.io/name: jaeger
    app.kubernetes.io/component: all-in-one
  type: ClusterIP
Setting up auto-instrumentation resources
With our platform configured to collect traces, the next step is to instrument our applications using the instrumentation objects. These objects enable our apps to automatically collect and send trace telemetry data without manual instrumentation.
For demonstration purposes, we'll set up instrumentation for two applications: a Python application and a Node.js application.
Instrumentation for the Python application
kubectl apply f - <<EOF
apiVersion: opentelemetry.io/v1alpha1
kind: Instrumentation
metadata:
  name: python-demo-instrumentation
spec:
  exporter:
    endpoint: http://demo-collector:4318
  propagators:
    - tracecontext
    - baggage
  sampler:
    type: parentbased_traceidratio
    argument: "1"
EOF
Instrumentation for the Node.js application
kubectl apply f - <<EOF
apiVersion: opentelemetry.io/v1alpha1
kind: Instrumentation
metadata:
  name: node-demo-instrumentation
spec:
  exporter:
    endpoint: http://demo-collector:4317
  propagators:
    - tracecontext
    - baggage
  sampler:
    type: parentbased_traceidratio
    argument: "1"
EOF
These configurations ensure that both Python and Node.js applications are equipped to gather trace telemetry data and communicate it to our previously set up OpenTelemetry Collector.
Building and deploying instrumented applications
To demonstrate how auto-instrumentation works, we'll set up a simple application stack:
- Python App: Acts as our backend.
- Node.js App: Serves as the frontend, making requests to the Python backend. This will help us understand how metrics are collected and how spans are associated.
Python backend
Here's a minimal Flask app:
from flask import Flask
app = Flask(__name__)

@app.route('/')
def hello():
  return "Hello World!"

if __name__ == '__main__':
  app.run(host='0.0.0.0', port=8000)
Node.js frontend
This Node.js app fetches telemetry data from the Flask backend:
const express = require('express');
const fetch = require('isomorphic-fetch');

const app = express();
const port = 3000;

app.get('/', async (req, res) => {
  try {
    const response = await fetch('http://flask-app-service:8000/');
    const data = await response.text();
    res.send(data);
  } catch (error) {
    console.error('Error:', error);
    res.status(500).send('Internal Server Error');
  }
});

app.listen(port, () => {
  console.log(`Server is running on port ${port}`);
});
Note: Both apps are devoid of OpenTelemetry library imports or in-code instrumentation. This highlights the power of auto-instrumentation; we don't manually set up our apps to send traces to the OpenTelemetry Collector.
Dockerizing apps
After writing the application code, you'll need to containerize these apps. Once containerized, you can load them into the kind cluster:
kind load docker-image -n python-demo-app
kind load docker-image -n node-demo-app
Deploy applications with instrumentation enabled
Before we deploy our applications, we need to prepare the specifications. Annotations for instrumentation.opentelemetry.io are used to indicate which instrumentation should be injected into the deployments.
Deploying the backend
kubectl apply -f - <<EOF
apiVersion: apps/v1
kind: Deployment
metadata:
  name: flask-app
spec:
  replicas: 1
  selector:
    matchLabels:
      app: flask-app
  template:
    metadata:
      labels:
        app: flask-app
      annotations:
        instrumentation.opentelemetry.io/inject-python: python-demo-instrumentation
    spec:
      containers:
      - name: python-test-app
        image: python-demo-app
        imagePullPolicy: IfNotPresent
        resources:
          limits:
            memory: "128Mi"
            cpu: "500m"
        ports:
        - containerPort: 8000
---
apiVersion: v1
kind: Service
metadata:
  name: flask-app-service
spec:
  selector:
    app: flask-app
  ports:
  - port: 8000
    targetPort: 8000
EOF
Deploying the frontend
kubectl apply -f - <<EOF
apiVersion: apps/v1
kind: Deployment
metadata:
  name: node-app
spec:
  replicas: 1
  selector:
    matchLabels:
      app: node-app
  template:
    metadata:
      labels:
        app: node-app
      annotations:
        instrumentation.opentelemetry.io/inject-nodejs: node-demo-instrumentation
    spec:
      containers:
      - name: node-test-app
        image: node-demo-app
        imagePullPolicy: IfNotPresent
        resources:
          limits:
            memory: "128Mi"
            cpu: "500m"
        ports:
        - containerPort: 3000
---
apiVersion: v1
kind: Service
metadata:
  name: node-app-service
spec:
  selector:
    app: node-app
  ports:
  - port: 3000
    targetPort: 3000
EOF
After executing these commands, our deployments will be initiated. Once they are ready, it's interesting to observe how the deployments have been modified by the operator to enable metric collection. Let's inspect one of them:
kubectl describe pod flask-app-6879886cdb-2rjwt
Upon examination, we can observe several modifications:
- New volume creation
Volumes:
  ...
  opentelemetry-auto-instrumentation:
    Type:        EmptyDir (a temporary directory that shares a pod's lifetime)
    Medium:
    SizeLimit:   <unset>
- Injection of an initialization container: This container copies OpenTelemetry instrumentation libraries to the newly added volume.
Init Containers:
  opentelemetry-auto-instrumentation:
    Container ID:  containerd://2119db597d29bd714a0314848df113135d945c9e69b9887f6c15088cbea8685b
    Image:         ghcr.io/open-telemetry/opentelemetry-operator/autoinstrumentation-python:0.40b0
    Image ID:      ghcr.io/open-telemetry/opentelemetry-operator/autoinstrumentation-python@sha256:c3816761a4b739aa5f46cca3500b1e4c7926fec7e02871c2117dfb4bb45eb887
    Port:          <none>
    Host Port:     <none>
    Command:
      cp
      -a
      /autoinstrumentation/.
      /otel-auto-instrumentation/
    State:          Terminated
      Reason:       Completed
      Exit Code:    0
      Started:      Fri, 01 Sep 2023 12:36:28 +0200
      Finished:     Fri, 01 Sep 2023 12:36:28 +0200
    Ready:          True
    Restart Count:  0
    Limits:
      cpu:     500m
      memory:  32Mi
    Requests:
      cpu:        50m
      memory:     32Mi
    Environment:  <none>
    Mounts:
      /otel-auto-instrumentation from opentelemetry-auto-instrumentation (rw)
      /var/run/secrets/kubernetes.io/serviceaccount from kube-api-access-bjggg (ro)
- Addition of environment variables: These variables are set for the main container.
Containers:
  python-test-app:
    ...
    Environment:
      PYTHONPATH:                           /otel-auto-instrumentation/opentelemetry/instrumentation/auto_instrumentation:/otel-auto-instrumentation
      OTEL_TRACES_EXPORTER:                 otlp
      OTEL_EXPORTER_OTLP_TRACES_PROTOCOL:   http/protobuf
      OTEL_METRICS_EXPORTER:                otlp
      OTEL_EXPORTER_OTLP_METRICS_PROTOCOL:  http/protobuf
      OTEL_SERVICE_NAME:                    flask-app
      OTEL_EXPORTER_OTLP_ENDPOINT:          http://demo-collector:4318
      OTEL_RESOURCE_ATTRIBUTES_POD_NAME:    flask-app-6879886cdb-2rjwt (v1:metadata.name)
      OTEL_RESOURCE_ATTRIBUTES_NODE_NAME:    (v1:spec.nodeName)
      OTEL_PROPAGATORS:                     tracecontext,baggage
      OTEL_TRACES_SAMPLER:                  parentbased_traceidratio
      OTEL_TRACES_SAMPLER_ARG:              1
      OTEL_RESOURCE_ATTRIBUTES:             k8s.container.name=python-test-app,k8s.deployment.name=flask-app,k8s.namespace.name=default,k8s.node.name=$(OTEL_RESOURCE_ATTRIBUTES_NODE_NAME),k8s.pod.name=$(OTEL_RESOURCE_ATTRIBUTES_POD_NAME),k8s.replicaset.name=flask-app-6879886cdb,service.version=python-demo-app
- Verification of directories: The PYTHONPATH environment variable points to directories that have numerous OpenTelemetry Python modules and their dependencies.
root@flask-app-6879886cdb-2rjwt:/app# ls -w 1 /otel-auto-instrumentation/
Deprecated-1.2.14.dist-info
__pycache__
_distutils_hack
asgiref
asgiref-3.7.2.dist-info
backoff
backoff-2.2.1.dist-info
bin
certifi
certifi-2023.5.7.dist-info
charset_normalizer
charset_normalizer-3.2.0.dist-info
deprecated
distutils-precedence.pth
google
googleapis_common_protos-1.59.1-py3.9-nspkg.pth
googleapis_common_protos-1.59.1.dist-info
idna
idna-3.4.dist-info
importlib_metadata
importlib_metadata-6.8.0.dist-info
opentelemetry
opentelemetry_api-1.19.0.dist-info
opentelemetry_distro-0.40b0.dist-info
opentelemetry_exporter_otlp_proto_common-1.19.0.dist-info
opentelemetry_exporter_otlp_proto_http-1.19.0.dist-info
opentelemetry_instrumentation-0.40b0.dist-info
opentelemetry_instrumentation_aio_pika-0.40b0.dist-info
opentelemetry_instrumentation_aiohttp_client-0.40b0.dist-info
opentelemetry_instrumentation_aiopg-0.40b0.dist-info
opentelemetry_instrumentation_asgi-0.40b0.dist-info
opentelemetry_instrumentation_asyncpg-0.40b0.dist-info
opentelemetry_instrumentation_boto-0.40b0.dist-info
opentelemetry_instrumentation_boto3sqs-0.40b0.dist-info
opentelemetry_instrumentation_botocore-0.40b0.dist-info
opentelemetry_instrumentation_celery-0.40b0.dist-info
opentelemetry_instrumentation_confluent_kafka-0.40b0.dist-info
opentelemetry_instrumentation_dbapi-0.40b0.dist-info
opentelemetry_instrumentation_django-0.40b0.dist-info
opentelemetry_instrumentation_elasticsearch-0.40b0.dist-info
opentelemetry_instrumentation_falcon-0.40b0.dist-info
opentelemetry_instrumentation_fastapi-0.40b0.dist-info
opentelemetry_instrumentation_flask-0.40b0.dist-info
opentelemetry_instrumentation_grpc-0.40b0.dist-info
opentelemetry_instrumentation_httpx-0.40b0.dist-info
opentelemetry_instrumentation_jinja2-0.40b0.dist-info
opentelemetry_instrumentation_kafka_python-0.40b0.dist-info
opentelemetry_instrumentation_logging-0.40b0.dist-info
opentelemetry_instrumentation_mysql-0.40b0.dist-info
opentelemetry_instrumentation_mysqlclient-0.40b0.dist-info
opentelemetry_instrumentation_pika-0.40b0.dist-info
opentelemetry_instrumentation_psycopg2-0.40b0.dist-info
opentelemetry_instrumentation_pymemcache-0.40b0.dist-info
opentelemetry_instrumentation_pymongo-0.40b0.dist-info
opentelemetry_instrumentation_pymysql-0.40b0.dist-info
opentelemetry_instrumentation_pyramid-0.40b0.dist-info
opentelemetry_instrumentation_redis-0.40b0.dist-info
opentelemetry_instrumentation_remoulade-0.40b0.dist-info
opentelemetry_instrumentation_requests-0.40b0.dist-info
opentelemetry_instrumentation_sklearn-0.40b0.dist-info
opentelemetry_instrumentation_sqlalchemy-0.40b0.dist-info
opentelemetry_instrumentation_sqlite3-0.40b0.dist-info
opentelemetry_instrumentation_starlette-0.40b0.dist-info
opentelemetry_instrumentation_system_metrics-0.40b0.dist-info
opentelemetry_instrumentation_tornado-0.40b0.dist-info
opentelemetry_instrumentation_tortoiseorm-0.40b0.dist-info
opentelemetry_instrumentation_urllib-0.40b0.dist-info
opentelemetry_instrumentation_urllib3-0.40b0.dist-info
opentelemetry_instrumentation_wsgi-0.40b0.dist-info
opentelemetry_propagator_aws_xray-1.0.1.dist-info
opentelemetry_propagator_b3-1.19.0.dist-info
opentelemetry_propagator_jaeger-1.19.0.dist-info
opentelemetry_propagator_ot_trace-0.40b0.dist-info
opentelemetry_proto-1.19.0.dist-info
opentelemetry_sdk-1.19.0.dist-info
opentelemetry_semantic_conventions-0.40b0.dist-info
opentelemetry_util_http-0.40b0.dist-info
packaging
packaging-23.1.dist-info
pkg_resources
protobuf-4.23.4.dist-info
psutil
psutil-5.9.5.dist-info
requests
requests-2.31.0.dist-info
setuptools
setuptools-68.0.0.dist-info
typing_extensions-4.7.1.dist-info
typing_extensions.py
urllib3
urllib3-2.0.3.dist-info
wrapt
wrapt-1.15.0.dist-info
zipp
zipp-3.16.2.dist-info
- Inside the /otel-auto-instrumentation/opentelemetry/instrumentation/auto_instrumentation directory, we find code responsible for injecting these modules into our application.
For Node.js applications, the process of injecting OpenTelemetry instrumentation libraries is similar.
Generating traffic
To verify that our setup is working as expected, we can expose our Node.js application and generate some sample traffic.
kubectl port-forward svc/node-app-service 3000:3000 &
curl localhost:3000
Hello World!⏎
We should receive a "Hello World!" response. But, were the traces collected? Let's find out.
Expose Jaeger web UI:
kubectl port-forward svc/jaeger-query 9080:80 &
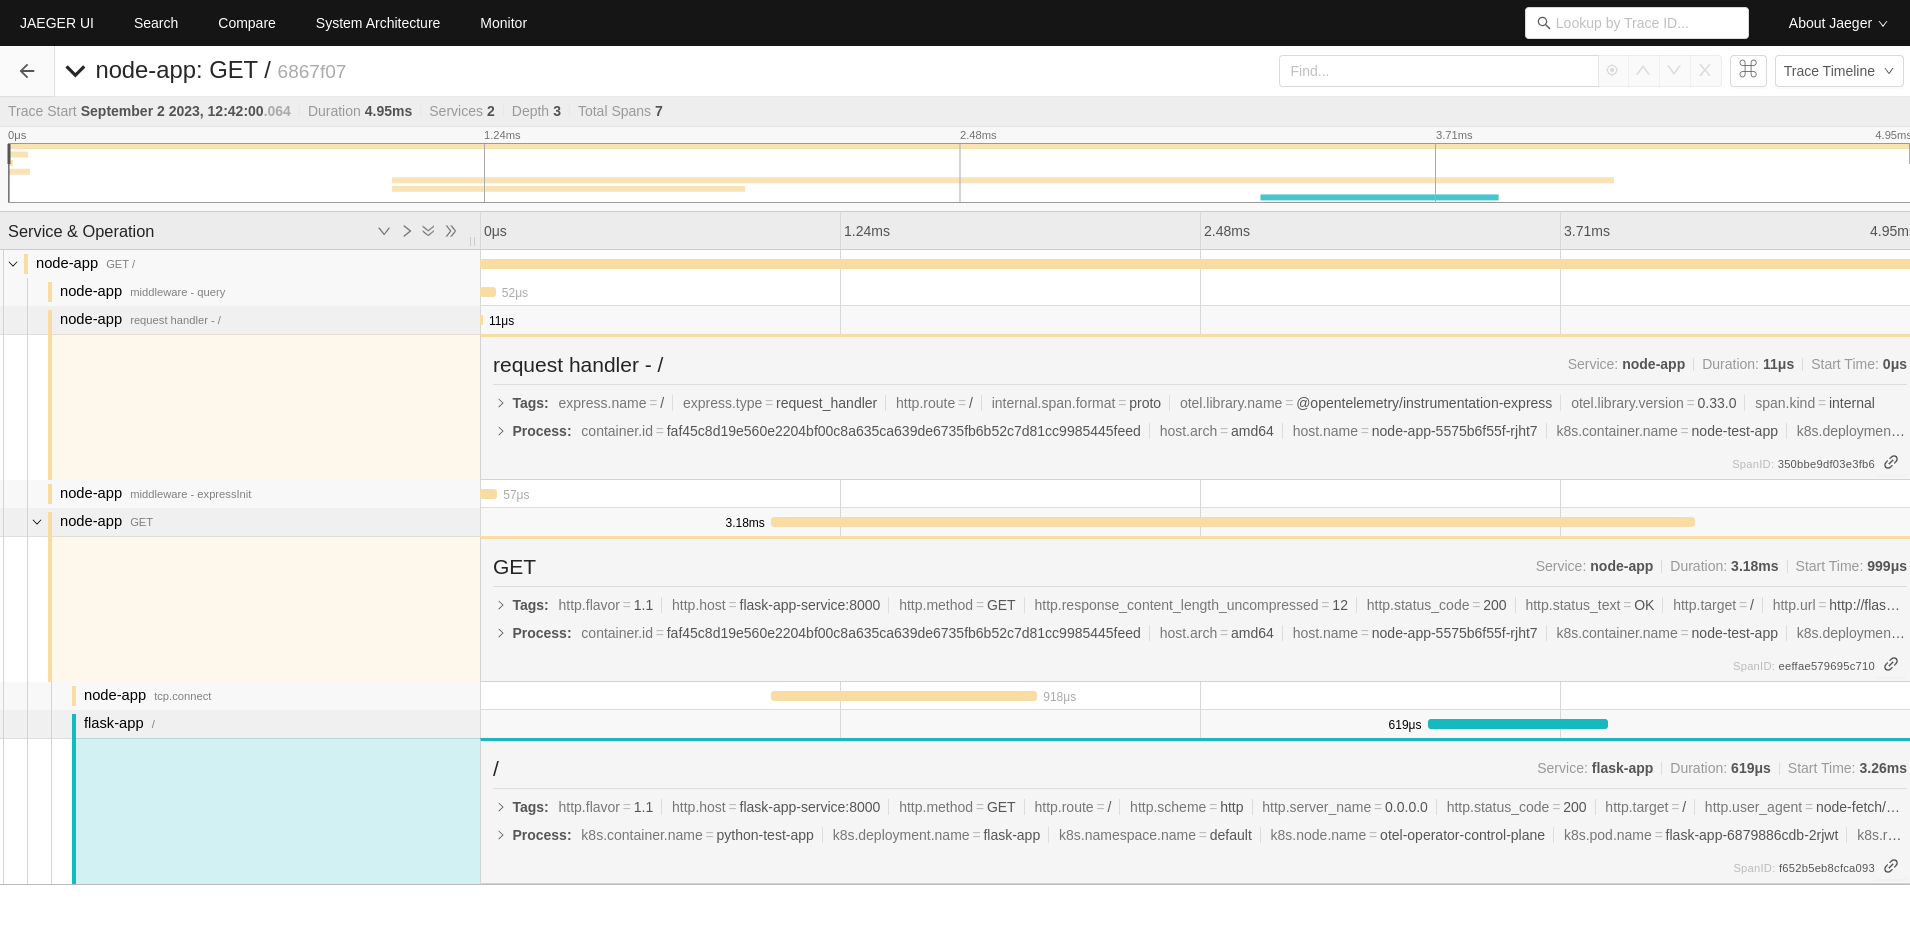
Then, navigate to http://localhost:9080 ![]() in your browser. If you search and expand the span traces for the node-app application, you should notice that traces have been successfully collected and are interlinked appropriately with our backend.
in your browser. If you search and expand the span traces for the node-app application, you should notice that traces have been successfully collected and are interlinked appropriately with our backend.
Summary
In conclusion, the Opentelemetry Operator stands as a groundbreaking tool in the modern telemetry landscape. It seamlessly facilitates the tracing of intricate applications on Kubernetes platforms. The major highlight? You can attain comprehensive application insights without altering a single line of your current application's code. This is especially invaluable in scenarios where an environment relies heavily on third-party applications. It streamlines the task of tracing, ensuring efficiency, accuracy, and depth of understanding, all while minimizing the manual overhead often associated with such endeavors. As we progress into an era of ever-evolving digital complexity, tools like OpenTelemetry Operator will undoubtedly be indispensable for businesses aiming to maintain transparency, performance, and user satisfaction.
Observability is a key part of modern cloud computing. OpenTelemetry helps by automatically keeping track of how different parts of your system communicate. Think of it like a dashboard for all your microservices. One standout feature? Auto-instrumentation. It does a lot of the setup work for you. But how do you use OpenTelemetry in Kubernetes? That's where the OpenTelemetry Operator comes in. It makes setting everything up in Kubernetes easy. In this post, we’ll introduce the OpenTelemetry Operator and show you a practical example of using its auto-instrumentation feature.
Here, you can find more information about our environment services, where we describe how we can support you in terms of monitoring and observability.


