


Think about a virtual conveyor belt for information. It's a system that automatically moves and processes data from one place to another, like from your smartphone to a cloud server or from a website to a database.
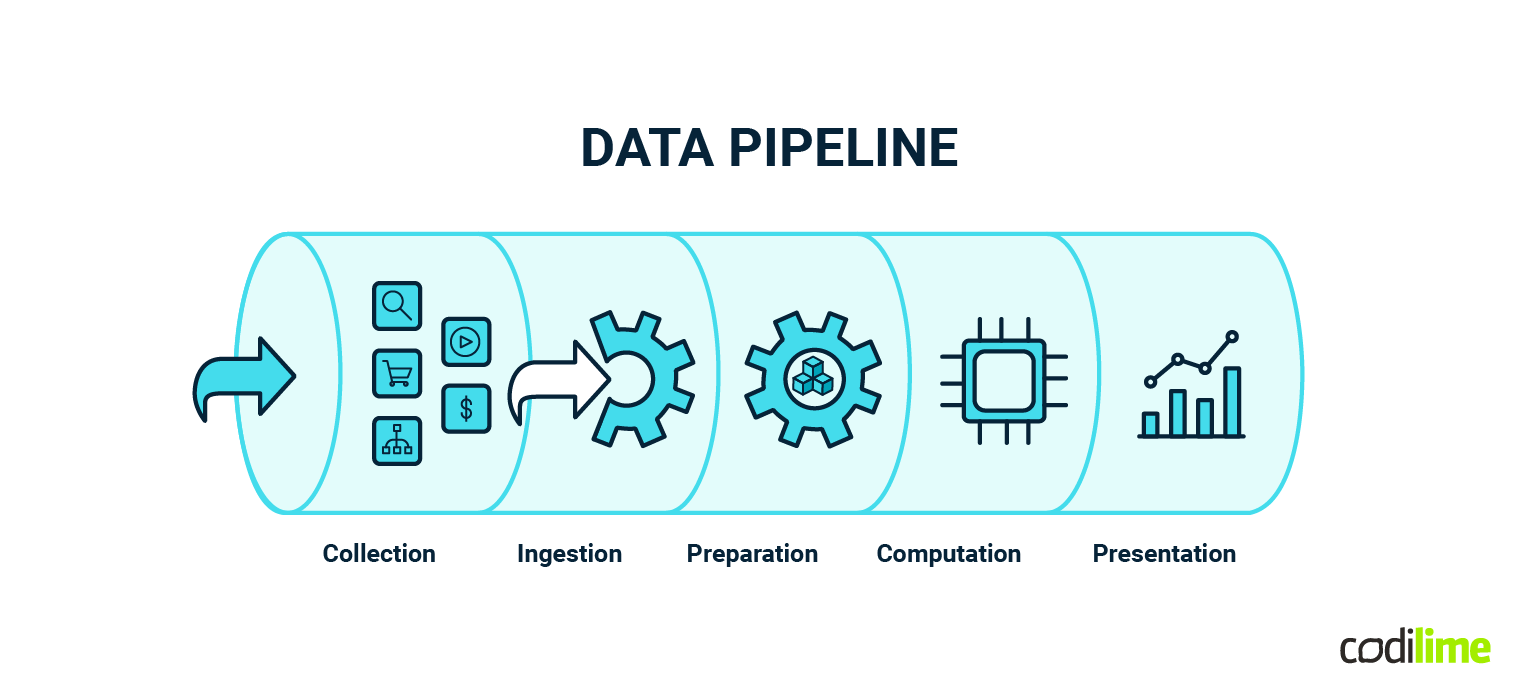
Think of it as a series of connected steps, each with a specific job. First, it collects data from various sources, like the clicks on your website or temperature readings from a sensor. Then, it cleans and organizes this data to ensure it's accurate and in the right format. After that, it stores the data in a safe and accessible location.
Once the data is stored, it goes through another set of processes to turn it into valuable and actionable insights. This might involve complex calculations, analysis, or even machine learning algorithms. Finally, the results are made available for people or applications to use, often in the form of reports, dashboards, or real-time updates.
Data pipelines are crucial in our data-driven world because they automate the flow of information, making it easier for businesses and organizations to make informed decisions, detect trends, and provide better services. They're like the behind-the-scenes choreographers ensuring that data moves seamlessly from source to action.
Main aspects of data pipeline architecture
1. Data sources
Data pipelines begin with various sources, including databases, external APIs, files, IoT devices, sensors, and streaming platforms. These sources contain raw data, which may be structured, unstructured, or semi-structured. The diversity of data sources means that the data pipeline architecture needs to be versatile and capable of handling different formats and data volumes.
2. Data ingestion
Data ingestion is the process of collecting data from its source and bringing it into the pipeline. This can be done in two primary ways: batch processing or real-time streaming. Batch processing involves collecting and processing data in fixed time intervals, while real-time streaming handles data as it's generated, providing near-instantaneous insights. Technologies like Apache Kafka and Apache Flume and cloud-based services such as AWS Kinesis are used for efficient data ingestion in both the earlier-mentioned scenarios.
3. Data transformation
Data in its raw form often requires significant cleaning and transformation. This stage involves tasks like data validation, cleaning, normalization, and feature engineering. Data is refined to ensure it is in a format suitable for downstream analytics, making it accurate, complete, and consistent.
We will dive deeper into this topic later, so make sure you also take a look at the extra insights in our article about data wrangling.
4. Data storage
Transformed data is stored in a repository that suits the organization's requirements. Common storage options include warehouses like Snowflake, AWS Redshift, or Google BigQuery for structured data; data lakes like Hadoop HDFS for unstructured data; and NoSQL databases for semi-structured data. Proper data storage ensures data is accessible, secure, and retrievable for analysis.
5. Data processing
After storage, data goes through processing to extract valuable insights. This can encompass a range of tasks, from basic aggregations to complex machine learning algorithms. Tools like Apache Spark, Apache Flink, and cloud-based flavors of those technologies like AWS EMR are used for efficient data processing. Data processing is where the data is transformed into actionable information.
6. Orchestration
Orchestration involves managing the workflow of data pipeline processes, ensuring they run efficiently and on schedule. Tools like Apache Airflow or cloud-based services offer the capability to schedule, monitor, and automate these processes. Orchestration is essential for ensuring that data flows smoothly from source to destination.
7. Data quality and monitoring
Maintaining quality is a vital part of the data pipeline architecture. Quality checks are performed at various stages to identify and address anomalies. Monitoring tools like Prometheus or the ELK stack are used to ensure the health of the pipeline. There are also dedicated data validation frameworks like Great Expectations, which help prepare readable data quality reports quickly. This includes tracking data completeness, correctness, and performance to prevent issues from impacting downstream processes.
8. Other (important) aspects
Data security
Data pipeline architecture must incorporate robust security measures. This includes encryption for data at rest and in transit, access controls to restrict who can access the data, and auditing to trace who has accessed the data and when. Data security is essential to protect sensitive information and maintain compliance with privacy regulations.
Data governance
Data governance involves establishing policies and processes for data management. This includes metadata management to track data lineage, version control for data changes, and compliance monitoring. Data governance ensures data integrity, accuracy, and accountability throughout the pipeline.
Error handling and recovery
Errors and failures are inevitable in a complex data pipeline architecture. Robust procedures for error handling and recovery are essential to minimize data loss and pipeline downtime. This includes mechanisms for retrying failed tasks, sending notifications, and logging errors for analysis.
Scalability
Data pipeline architecture must be designed for scalability to accommodate growing data volumes and evolving business needs. Scalability can be achieved through horizontal scaling (adding more servers or nodes) or vertical scaling (upgrading existing resources). A well-designed pipeline can adapt to increased data loads without major rearchitecting. I highly recommend you read our article about cloud-based ETL and data integration tools for more information.
Deployment and automation
Automation is the key to managing and deploying data pipeline architecture efficiently. Continuous integration/continuous deployment (CI/CD) practices ensure that the updates and changes to the pipeline are seamlessly integrated and tested before deployment. Automation reduces the risk of errors and streamlines the development process.
Documentation
Comprehensive documentation is crucial for maintaining the pipeline and onboarding new team members. Documentation should include architectural diagrams, data flow descriptions, metadata, and clear procedures for troubleshooting and maintenance. As the reader might be aware, in the case of robust documentation, it is tough to keep it up to date. That’s why it is highly recommended to consider autogenerating frequently changing parts based on relevant code pieces and pipeline metadata.
Data retention and archiving
Policies for data retention and archiving are essential to managing storage costs and complying with data privacy regulations. These policies dictate how long data should be retained in active storage, when and how it should be archived, and when it can be safely deleted.
Disaster recovery
Data pipeline architecture needs disaster recovery strategies to ensure data integrity and maintain pipeline functionality in case of natural disasters, hardware failures, or other unexpected outages. This includes off-site backups and replication to ensure data resilience.
Performance optimization
Continuous monitoring and optimization of the pipeline are essential for maintaining efficient performance and controlling costs. This involves analyzing resource usage, identifying bottlenecks, and making improvements to the data pipeline architecture.
Data visualization and reporting
Data pipelines often feed into data visualization tools and reporting platforms, allowing stakeholders to gain insights and make informed decisions. Dashboards and reports provide an accessible means of interpreting data for non-technical users.
If you want to learn more about the tools mentioned above, see our list of top data engineering tools, and check how we can support you with our data services.
Collecting and storing the data
While the first part of the article was all about theoretical foundations, now it's time to get to the juicy part and do some practice. Let's imagine that your boss is asking you to report on some weather information. After a quick google, you have found the National Oceanic and Atmospheric Administration. They offer a free API. This will be our little project - the first data pipeline. Great! Let’s begin!
Data collection and storage
This API provides historical weather data by specifying the location, date, and data elements like temperature or precipitation.
We will use Python to make HTTP requests to the API and retrieve JSON responses.
In our case, the data will be in the JSON format, which is not very good for processing and creating relations, but it will be just fine for demo purposes.
{
   "date": "2023-01-15",
   "location": "NewYork",
   "temperature": [
…….
}
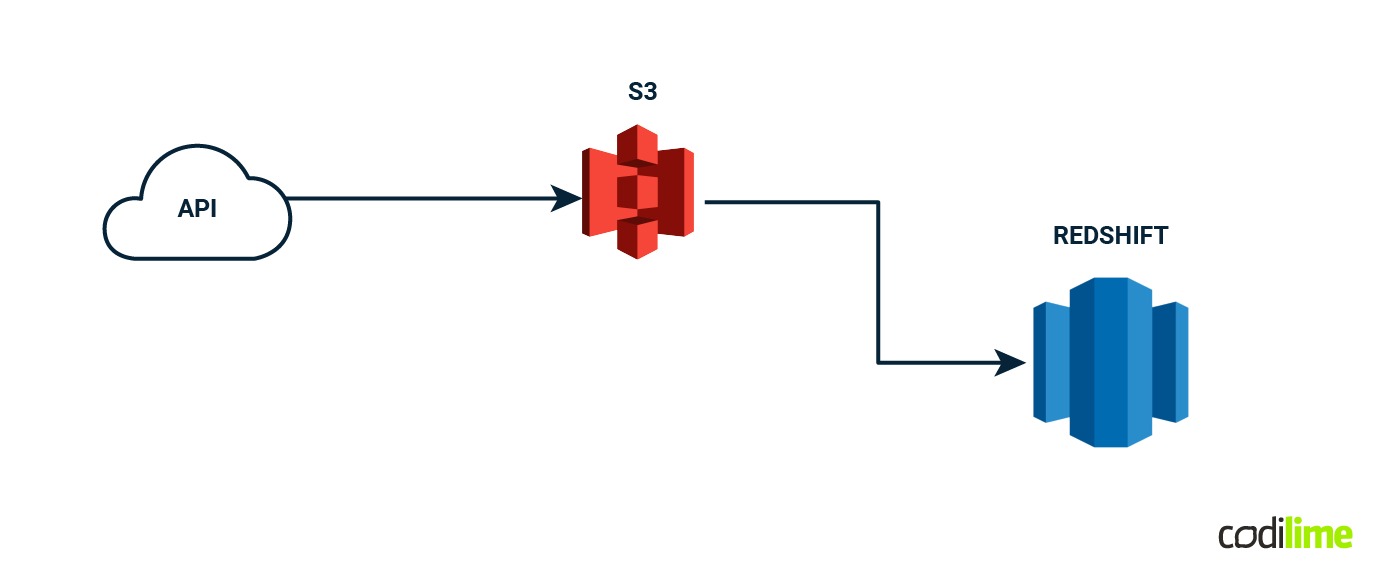
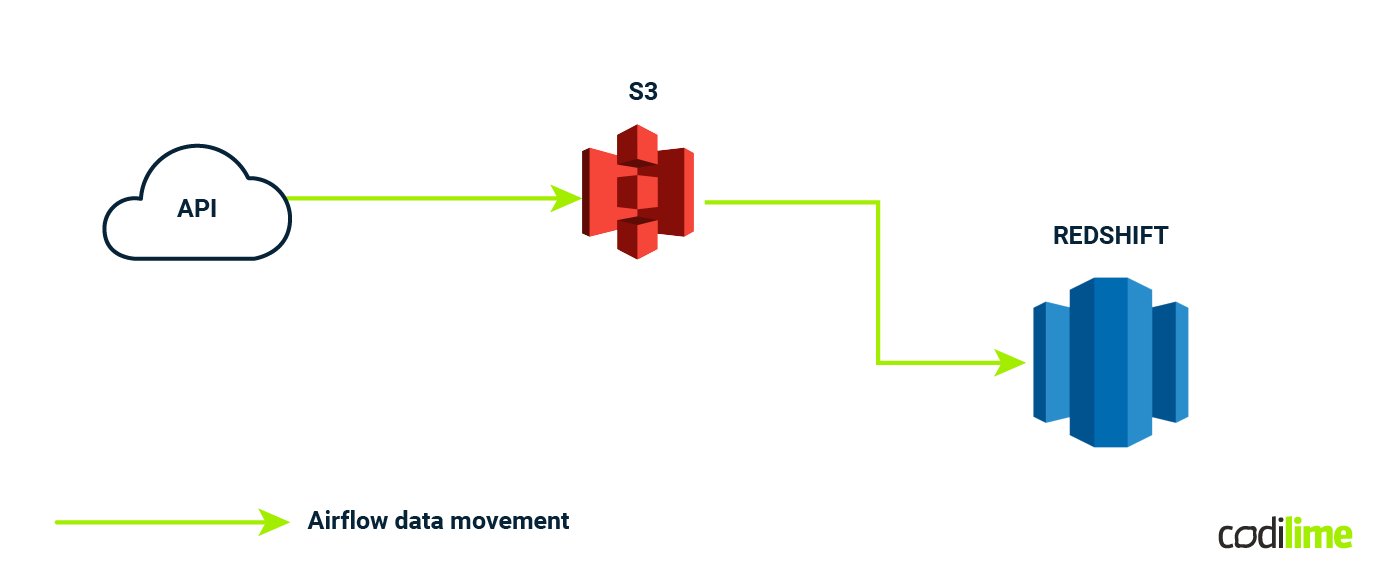
Now we need to store it somewhere - let's use AWS S3.
The next step would be to extract useful data and load it into our database. Our choice would be Amazon Redshift, which is the industry standard for relational warehouse processing. It's where we'll put our data so we can work with it more easily. To do this, we need to use something like AWS Glue or custom scripts to move our data from S3 into Redshift. It's similar to moving your clothes from a suitcase to a wardrobe.
Data warehouse
A data warehouse is a specialized type of database designed for the storage, retrieval, and analysis of large volumes of structured data. It is a central repository that consolidates data from various sources within an organization and transforms it into a format suitable for complex analytical querying and reporting.
To build a warehouse inside AWS Redshift, we need to pick one of the three most popular designs:
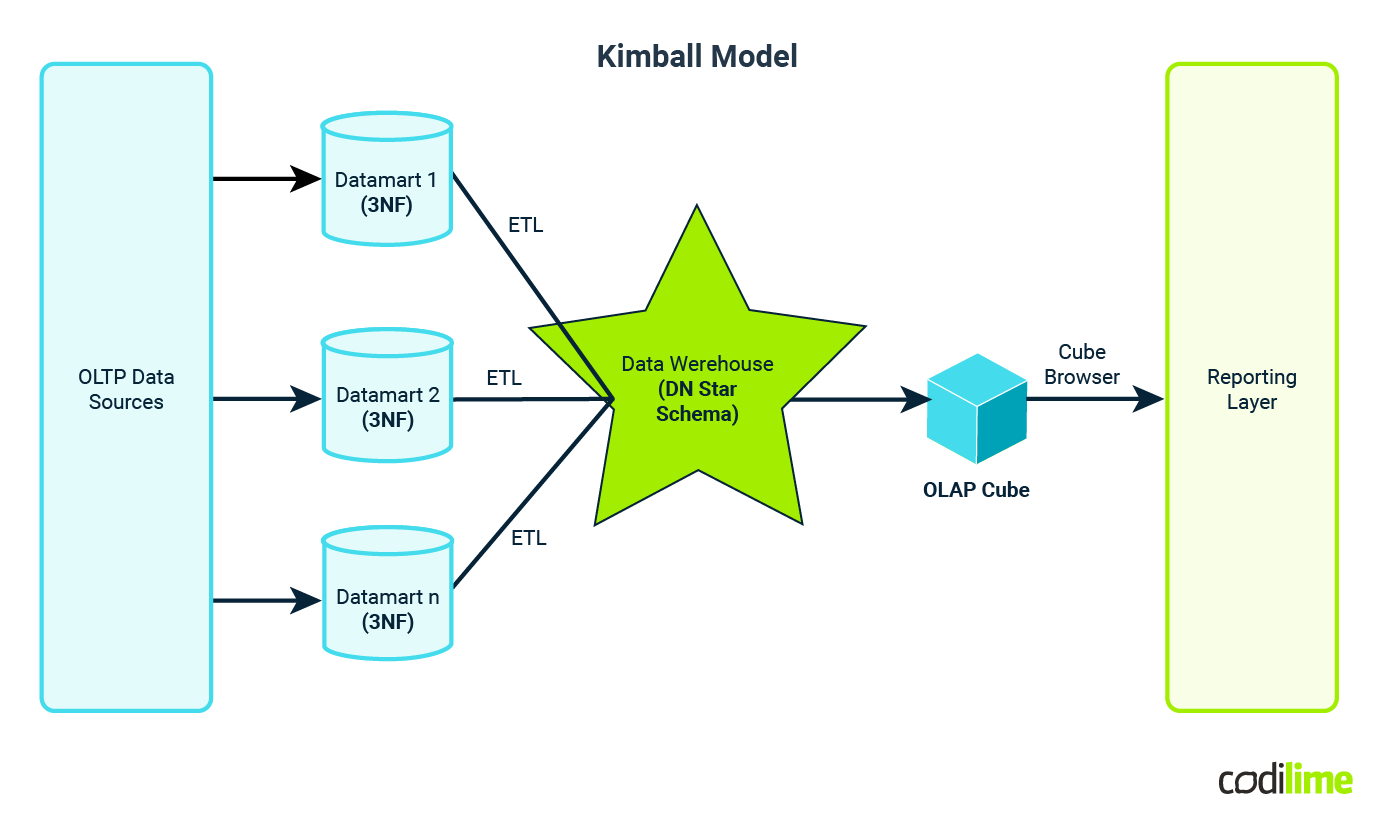
1. Kimball design
Kimball emphasizes a dimensional modeling approach, which organizes data into facts (measurable business events) and dimensions (contextual information). It's known for its flexibility and user-friendliness, making it easier for end users to query and report data. Kimball typically employs a denormalized or dimensional modeling approach, which means that data is often intentionally kept in a somewhat denormalized form within data marts (subsets of the warehouse).
Denormalization in Kimball helps optimize query performance and simplifies user access by reducing the number of joins required in complex SQL queries.
While Kimball doesn't strictly adhere to traditional database normalization rules, it does ensure that dimensions are typically highly normalized, while fact tables contain denormalized data for ease of reporting.
Pros:
- User-friendly: Kimball's dimensional model is intuitive and user-friendly, making it easier for end users to understand and query data.
- Fast development: Data marts can be developed quickly, providing faster access to relevant data for business users.
- Flexibility: Kimball allows for agile development and accommodates changes and evolving business requirements.
- Business focus: It aligns closely with business needs and is driven by business users' requirements.
Cons:
- Data redundancy: Denormalization can lead to some data redundancy, potentially increasing storage requirements.
- Performance trade-offs: While optimized for query performance, complex queries might require more joins and be slower.
- May lack data consistency: Denormalization can sometimes result in data inconsistencies if not managed properly.
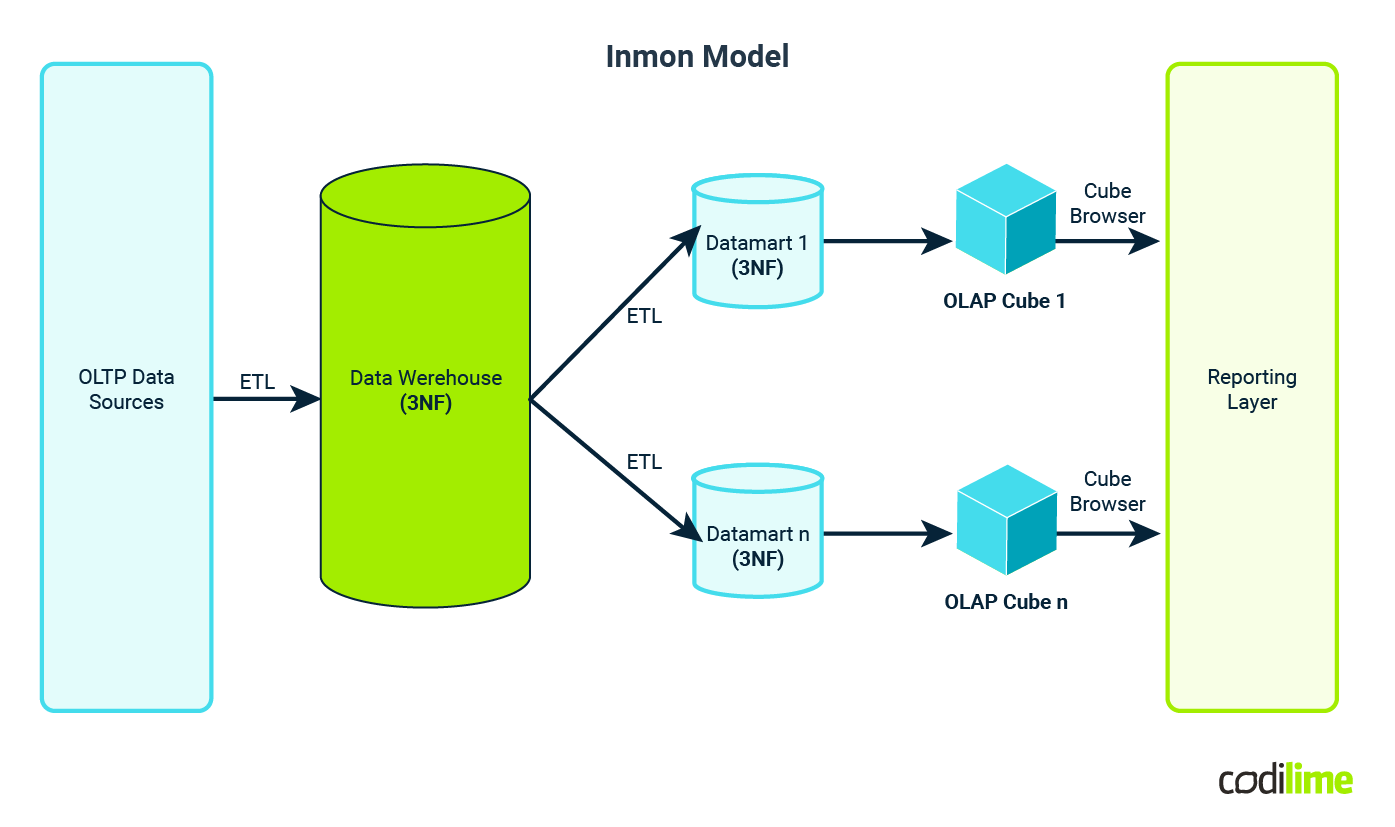
2. Inmon Design
Inmon promotes an enterprise-wide data warehousing approach, focusing on a centralized data repository. It ensures quality and consistency of data but can be more complex and time-consuming to implement. Inmon favors a more normalized approach. Data is stored in highly normalized forms in the centralized warehouse.
Normalization in Inmon ensures data consistency and integrity. It reduces data redundancy and makes updates and maintenance more straightforward.
The emphasis on normalization can lead to complex query structures and may require more joins for complex analytical queries.
Pros:
- Data integrity: Inmon's normalized approach ensures high data integrity and consistency.
- Single source of truth: Centralized data warehousing provides a single source of truth for the entire organization.
- Scalability: It can accommodate large amounts of data and complex data structures.
- Data governance: Inmon's structure is well-suited for data governance and compliance.
Cons:
- Complexity: The approach can be more complex to implement due to its focus on normalization.
- Development time: Development and deployment may take longer because of the centralized structure.
- Potential performance issues: Queries may require more joins and could be slower due to the highly normalized data structure.
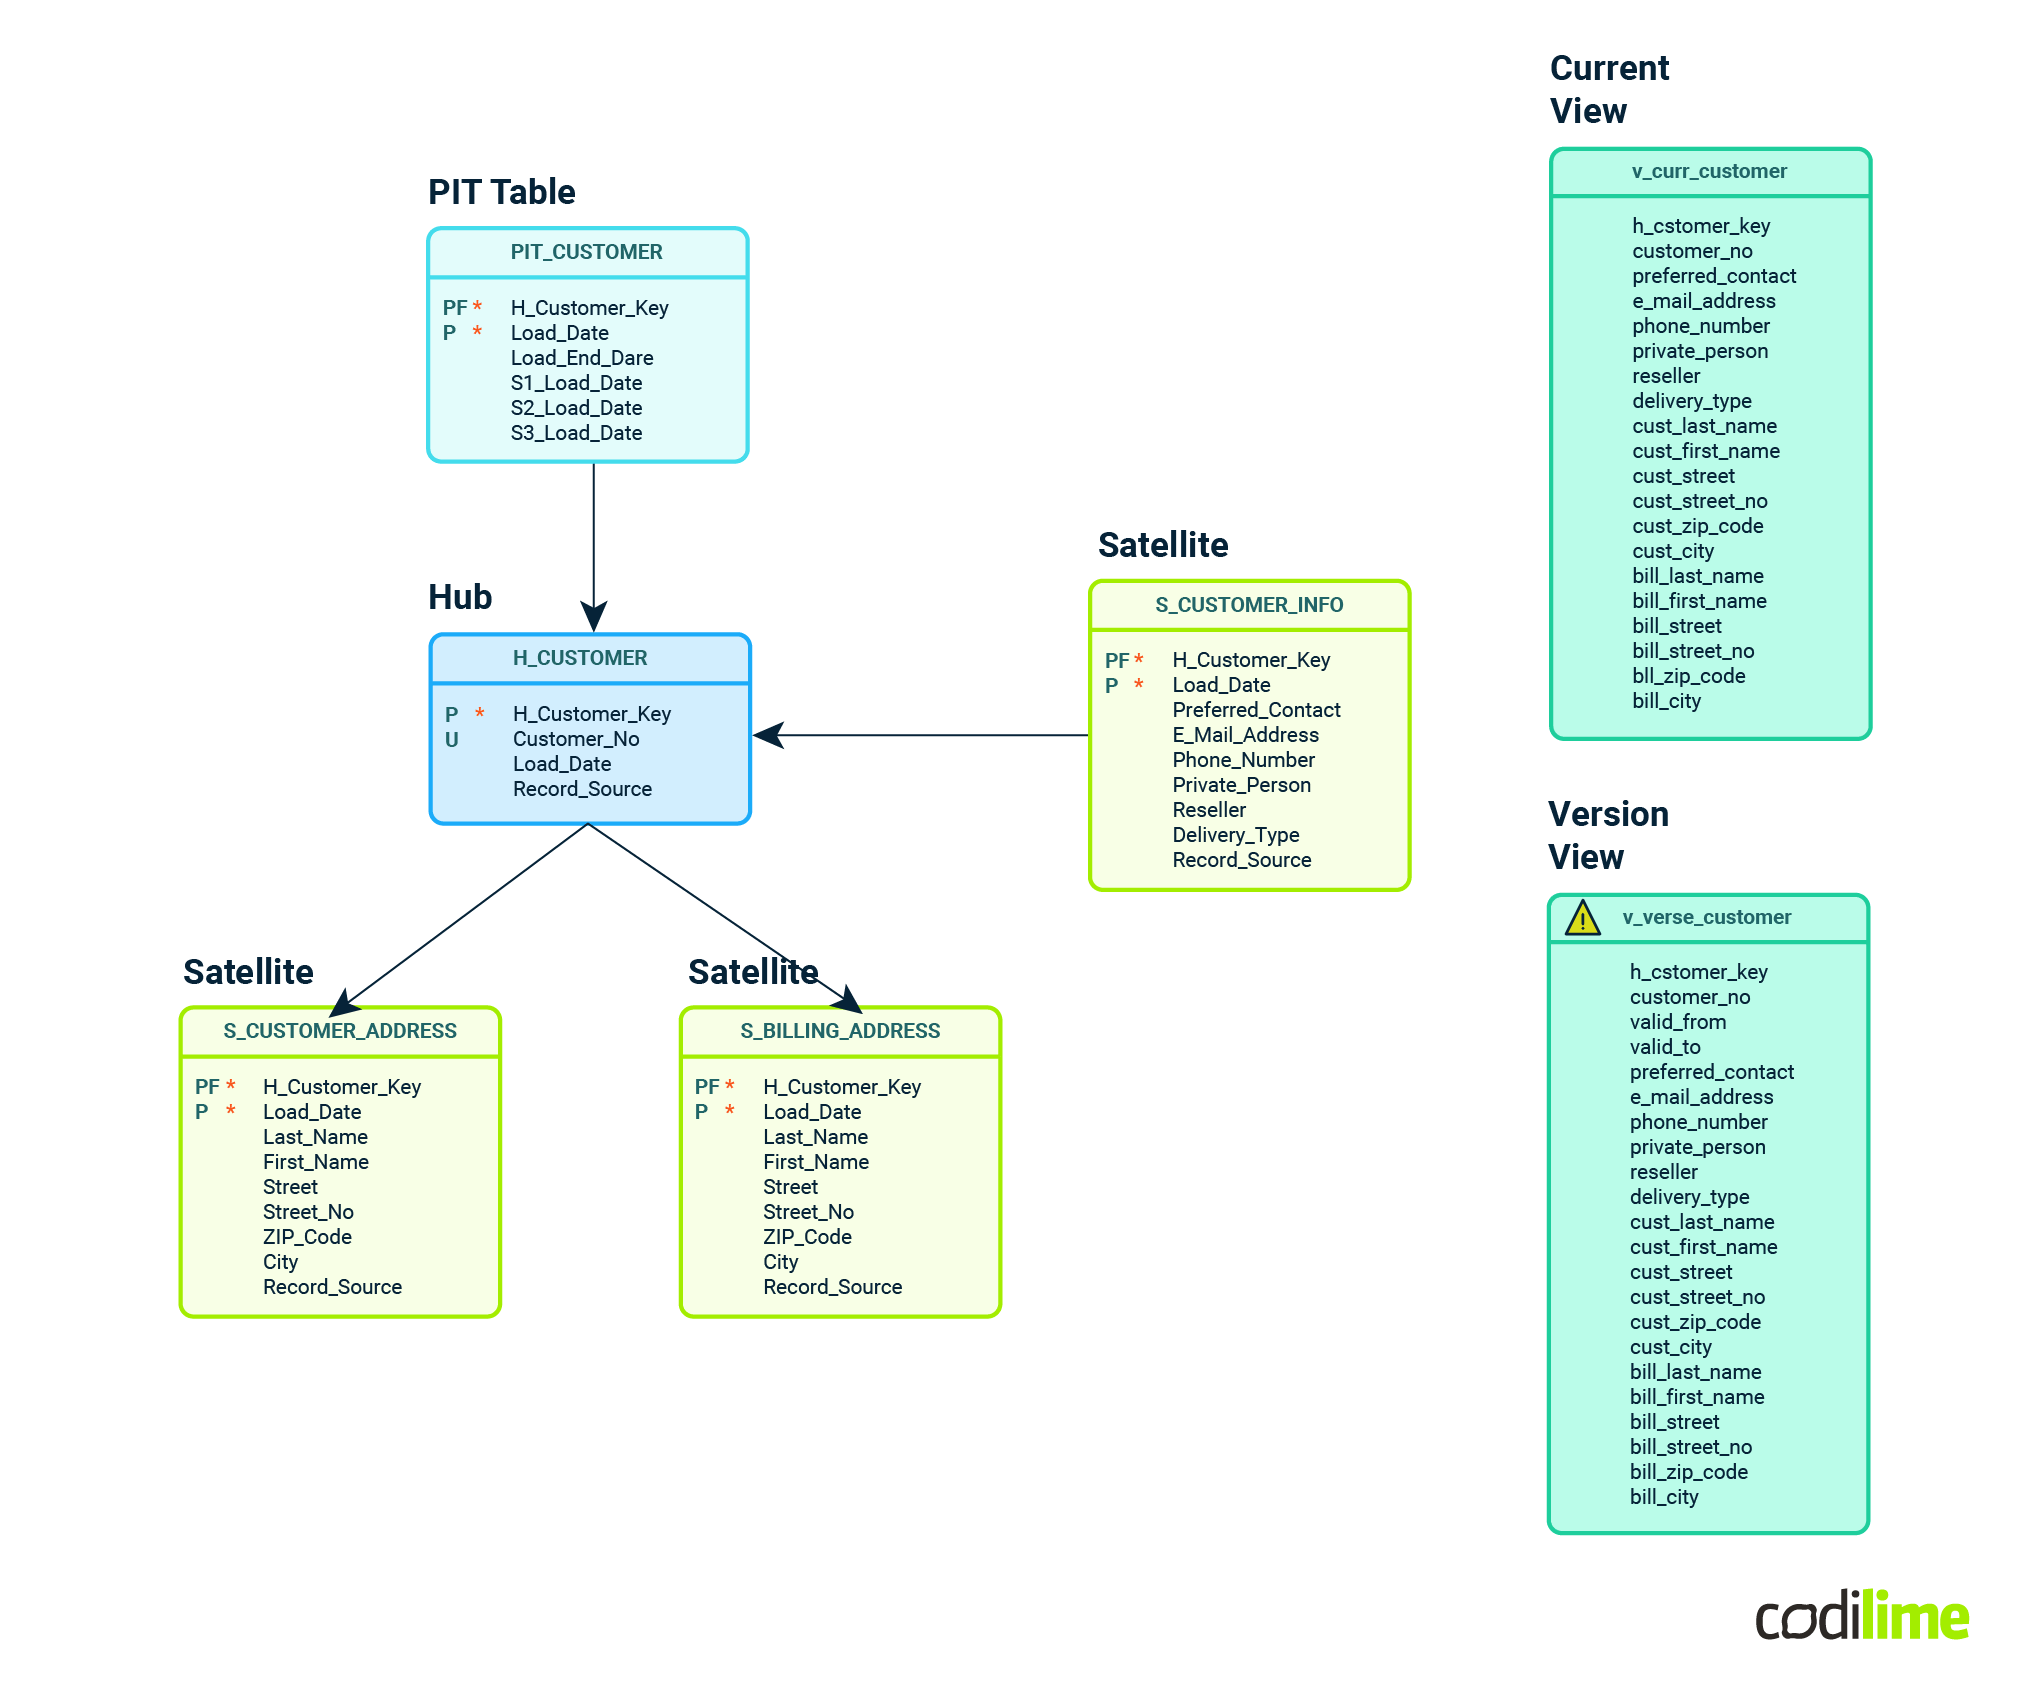
3. Data Vault 2.0
Data Vault 2.0 is an agile, scalable data modeling methodology. It divides data into raw, business, and access layers, facilitating a flexible and adaptive warehouse design. It's designed for rapid development and accommodates changes easily. Data Vault 2.0 takes a hybrid approach.
The raw layer holds data in its most granular, normalized form. It's designed for flexibility and ease of ingestion.
The business layer acts as a bridge, where data is somewhat denormalized for business logic, and the access layer may further denormalize data for reporting and analysis. This layering provides the best of both worlds - normalized data for consistency and denormalized data for performance.
Pros:
- Flexibility: Data Vault 2.0 is highly agile and adaptable to changing business needs.
- Rapid development: It enables faster development of data warehousing solutions, supporting quick response to business demands.
- Scalability: Well-suited for handling large data volumes and accommodating evolving data requirements.
- Hybrid approach: The hybrid structure offers both normalized and denormalized layers, providing the benefits of both worlds.
Cons:
- Complex architecture: The layered structure can be complex to implement and manage.
- Additional overheads: The hybrid approach may introduce added complexity and potential overhead in maintaining the different layers.
- Possible confusion: The mix of normalized and denormalized data can lead to potential confusion in data modeling and usage.
Each design methodology has its trade-offs regarding normalization. Kimball prioritizes user-friendliness and query performance, Inmon focuses on data integrity and consistency through normalization, and Data Vault 2.0 balances flexibility and performance by combining normalization and denormalization in different layers.
The choice of methodology depends on the specific needs and goals of an organization.
Data lake
In some cases, we use a data lake to store our data. Let's see what a data lake is.
We can keep data in its raw form for data scientists to use and at the same time process this data in a relational database that meets ACID principles.
A data lake is a centralized and scalable repository that allows organizations to store vast amounts of structured, semi-structured, and unstructured data in its raw, native format. This data can include everything from text and images to log files, sensor data, and more. Data lakes are a fundamental component of modern data architecture and offer several key features:
- Storage flexibility: Data lakes are designed to accommodate data in its raw, untransformed form. This makes them highly versatile and suitable for storing data of various types and formats, including big data.
- Scalability: Data lakes can handle enormous data volumes. They can easily scale horizontally to accommodate growing data needs.
- Cost-efficiency: Cloud-based data lakes, such as those on AWS or Azure, offer cost-effective storage solutions, where organizations pay only for the storage capacity they use.
- Schema on read: Unlike traditional databases, data lakes use a "schema-on-read" approach, which means that data doesn't need to be structured before it's ingested. The schema is applied when data is read or queried, offering more flexibility and faster development of the new features.
- Data integration: Data lakes can ingest data from a variety of sources, including batch and real-time data, databases, log files, IoT devices, and more. This makes them suitable for consolidating diverse data sources.
- Data exploration and analysis: Users can explore and analyze data in a data lake using various data processing and analytics tools, such as Apache Spark or Hadoop, as well as machine learning and data visualization tools.
- Historical data: Data lakes can store historical data, making them valuable for trend analysis, historical comparisons, and machine learning training.
However, data lakes also have some challenges to consider:
- Data quality: The flexibility of data lakes can sometimes lead to issues with quality and consistency if not managed carefully.
- Data governance: Data governance and security can be complex, requiring the implementation of access controls, encryption, and data cataloging to maintain data integrity and compliance.
- Complexity: The schema-on-read approach means that the structure of the data is not defined until it's accessed. This can make data lakes more complex for users to navigate and query effectively.
Data lakes are a key component of modern data architectures, providing organizations with the ability to store and process massive data volumes while enabling data scientists and analysts to explore, analyze, and extract valuable insights from diverse datasets.
Data orchestration
To metaphorically explain data orchestration, one could say:
Data orchestration is the symphony that harmonizes the diverse instruments of data, turning raw information into a melodious flow of insights and actions. Just as a conductor coordinates musicians to produce beautiful music, data orchestration brings together various data sources, processing tasks, and actions, ensuring they work in harmony to produce meaningful outcomes.
In our case, it simply means that we need to collect info from the given API regularly.
But when we decide to add another data source - that is when magic begins. Let's say that our NOAA data will arrive every two weeks, but our second dataset could be added every day - and our data orchestration design and systems must work with these circumstances. Two is good but what about handling as much as 200 data sources? The sky's the limit! (On the contrary, the depth of your pocket might be an influence since processing tera or petabytes of data is not cheap).
After deep research, we decided to go for a combination of Airflow and DBT.
Here ![]() is an example of a similar choice.
is an example of a similar choice.
Apache Airflow
Apache Airflow is an open-source workflow automation platform used for orchestrating complex data workflows. It is written in Python, and its extensive library of pre-built operators and integrations makes it a popular choice in data engineering. Airflow is free to use and highly extensible.
dbt (data build tool)
dbt is an open-source command-line tool for transforming data in your warehouse. It's also written in Python and uses SQL for data transformations. dbt focuses on data modeling, testing, and documentation. It's free to use and has a growing community of users in the data analytics and engineering space.
Using Apache Airflow in combination with dbt is a powerful choice for orchestrating and managing your data pipeline architecture. Here's how you can leverage this combination effectively:
1. ETL orchestration:
Use Apache Airflow to define, schedule, and manage your ETL (extract, transform, load) workflows. Airflow allows you to set up workflows as directed acyclic graphs (DAGs), making it easy to manage dependencies between tasks.
2. Data transformation with dbt:
Within your Airflow DAG, include tasks that invoke dbt to perform data transformations. dbt enables you to write SQL queries to transform raw data into structured and clean data ready for analysis.
3. Data pipeline monitoring:
Apache Airflow provides extensive monitoring capabilities, allowing you to track the progress of your ETL pipelines, detect failures, and set up alerting mechanisms.
4. Scheduling and dependency management:
You can use Airflow to schedule ETL jobs at specific intervals or in response to triggers. It also manages dependencies, ensuring that tasks run in the correct order.
5. Modular and extensible:
Both Apache Airflow and dbt are highly modular and extensible. You can add custom operators and hooks to Airflow or create reusable dbt models for different data transformations.
6. Version control:
dbt models and SQL transformations can be version-controlled using tools like Git, ensuring that changes are tracked and you can roll back to previous versions if necessary.
7. Data testing and validation:
dbt includes data testing capabilities, enabling you to define and run tests to validate the quality of your transformed data. You can integrate these tests within your Airflow workflows to ensure data accuracy.
8. Documentation:
Both tools promote documentation. dbt encourages documenting data models, transformations, and tests, while Apache Airflow allows you to provide task-level documentation to improve collaboration and understanding of your workflows.
9. Logging and auditing:
Airflow and dbt both offer logging and auditing features, helping you trace the execution of tasks and maintain data lineage for compliance and debugging.
Once again, the combination of Apache Airflow and dbt provides a robust data orchestration and transformation framework. It's commonly used in modern data stack architectures, especially in data warehousing and analytics projects. This setup offers flexibility, control, and automation, making it easier to manage and maintain complex data pipelines.
Data quality and monitoring
Keys are the foundation of relations
In the realm of data warehousing (obviously in the transactional databases as well), keys are the foundation upon which relationships are built and data is organized. Keys serve as the fundamental building blocks that enable efficient data retrieval, ensure data integrity, and support the establishment of relationships between tables within a warehouse. Here's a more detailed exploration of keys in data warehousing:
-
Primary key: The primary key is a unique identifier for each record in a table. It ensures that each row has a distinct identity, preventing duplication and serving as a reference point for relationships with other tables. For example, in a sales data warehouse, the primary key for the "Customers" table could be the customer ID.
Customers: The primary key for the "Customers" table could be the "CustomerID," a unique identifier for each customer.
-
Foreign key: Foreign keys are keys in one table that refer to the primary key in another table, creating relationships between tables. These relationships enable the retrieval of data from related tables and help maintain data consistency. In our sales data warehouse, the "Orders" table might have a foreign key that links each order to a specific customer through the customer's primary key.
Orders: In the "Orders" table, there could be a foreign key, "CustomerID", that refers to the primary key in the "Customers" table. This relationship links each order to a specific customer.
-
Surrogate key: Surrogate keys are system-generated unique identifiers assigned to each record in a warehouse. They are particularly useful when dealing with source data that lacks a natural primary key. Surrogate keys simplify data management and enhance performance.
OrderDetails: If the source data doesn't have a natural primary key for the "OrderDetails" table, you can introduce a surrogate key, such as "OrderDetailID," which serves as a unique identifier for each line item.
-
Composite key: A composite key is formed by combining two or more columns to create a unique identifier. It is often used when no single column can serve as the primary key. For instance, a "Line Items" table in our sales data warehouse might use a composite key, combining order number and product ID.
OrderDetails: To ensure that line items within the "OrderDetails" table are unique, you can use a composite key by combining "OrderID" and "ProductID." This combination acts as the primary key for this table.
-
Business key: The business key is a key that reflects the natural identifiers in the source data, such as a customer's email address. It's valuable for data lineage and traceability.
Customers: The "Email" field in the "Customers" table can serve as a business key. It reflects the natural identifier used in real-world business interactions. It helps in traceability and is essential when you want to link data back to the source. Remember that it is not a good practice to utilize natural identifiers as primary keys.
Keys play a pivotal role in maintaining quality, enabling efficient joins between tables, and ensuring that data warehousing systems can effectively deliver valuable insights. By establishing these key relationships, warehouses provide a solid foundation for data modeling, analytics, and reporting, and contribute to the success of data-driven decision-making in organizations.
Data monitoring and validation
After the introduction of basic ideas around different kinds of keys, we can move on to more robust methods of ensuring data completeness and quality. As mentioned before, you can use Apache Airflow and dbt (data build tool) to perform quality checks and monitoring. Here's how you can leverage these tools for data quality checks:
Using Apache Airflow:
- Workflow scheduling: You can schedule Airflow tasks to run quality checks at specific intervals or in response to events. Airflow allows you to create dynamic and complex workflows, making it well-suited for automating checks.
- Custom operators: Airflow offers the flexibility to create custom operators that execute data quality checks. For example, you can create an Airflow operator that runs SQL queries to check for null values, duplicates, or other issues regarding quality.
- Alerting and notifications: You can configure Airflow to send alerts or notifications when the checks fail, ensuring that data issues are promptly addressed.
- Error handling: Airflow enables you to define error-handling mechanisms, such as retrying failed tasks or taking specific actions when quality checks fail.
Using dbt:
- Data validation models: dbt allows you to define data validation models within your dbt project. These models are SQL queries that check data for quality issues, such as null values, data type consistency, or referential integrity.
- Automated testing: dbt provides a testing framework that allows you to write test cases to validate your data. You can include these tests as part of your dbt project and run them automatically.
- Documentation: dbt encourages data documentation, which is crucial for maintaining quality of data. You can document data models, transformations, and test cases to improve collaboration and understanding.
By integrating both Apache Airflow and dbt into your data orchestration process, you can establish a comprehensive data quality framework. Apache Airflow handles the scheduling, automation, and monitoring of data quality checks, while dbt focuses on the data validation logic and testing. This combination ensures that your data pipeline architecture not only transforms data but also maintains data quality and reliability.
Here's an example of a dbt data validation model that checks for null values in a specific column of a dataset. This is a simple yet common data validation scenario:
-- Data Validation Model: Check for NULL Values

-- Test to check for NULL values in the 'column_name' column
{{
  config(
	materialized='table',
	tags=['data_validation']
  )data quality
}}

with null_value_check as (
  select
	'Check for NULL values in column_name' as test_description,
	case
  	when count(*) = 0 then 'Pass'
  	else 'Fail'
	end as test_result
  from source.your_dataset
  where column_name is null
)
Using Great Expectations
Data validation with Great Expectations:
- Great Expectations, as a part of the data pipeline architecture, offers a powerful framework for data validation. It allows you to define, document, and automate data quality checks to ensure that the incoming data meets expectations and conforms to predefined rules.
- With Great Expectations, you can set expectations on various aspects of your data, including schema, distribution, and statistical properties. These expectations act as automated tests, providing a systematic way to validate and monitor data quality throughout the data pipeline architecture.
- By integrating Great Expectations into your data pipeline architecture, you enhance its robustness by adding a layer of automated validation, ensuring that the data flowing through the data pipeline aligns with the expected characteristics. This proactive approach to data quality contributes to more reliable analytics and decision-making downstream.
All these tools can guarantee that your data will be delivered on time with great accuracy and with minimal impact on your wallet.
Presentation
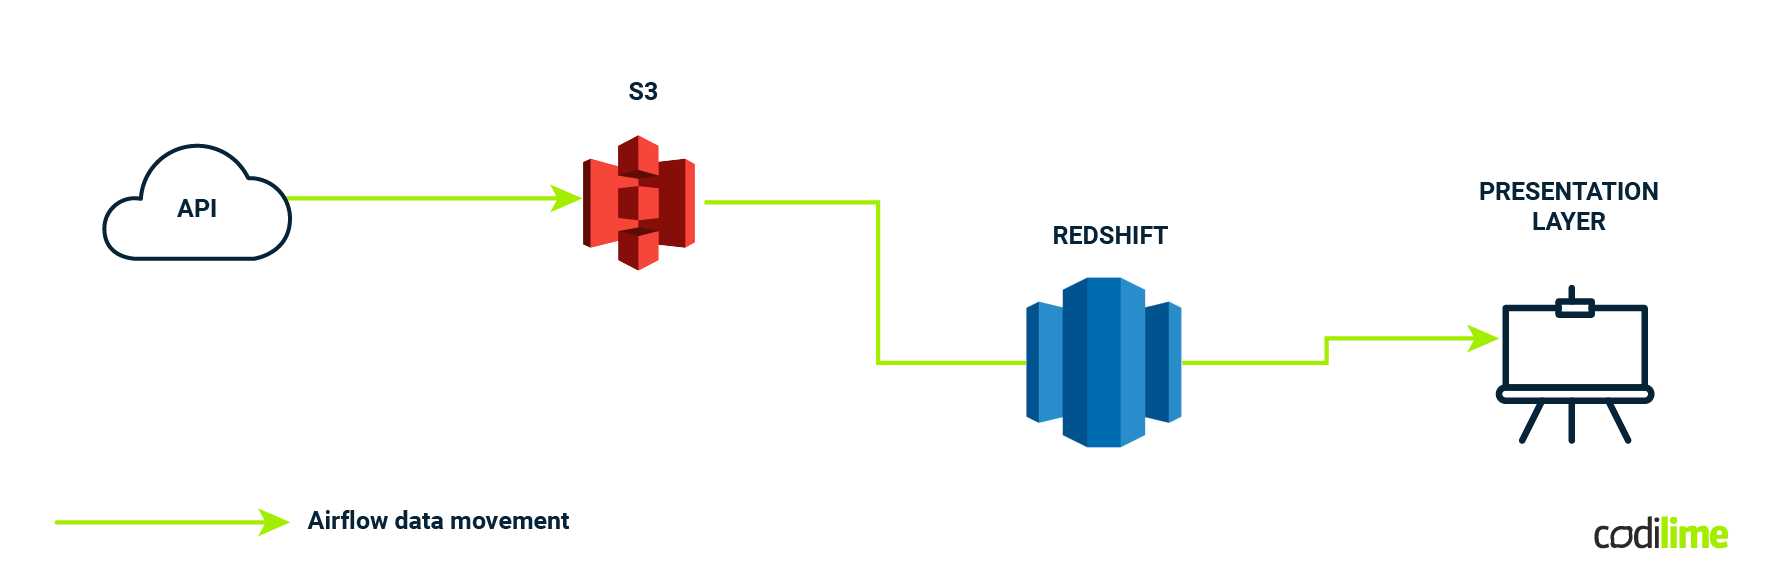
Presentation layer
The presentation layer in a data warehouse plays a crucial role in making data accessible and usable for end users. Here are some pros and cons of the presentation layer in a data warehouse:
Pros:
- Data accessibility: The presentation layer provides users with a user-friendly interface to access and interact with data. It simplifies the process of retrieving information from complex databases.
- Data visualization: It enables the visualization of data through charts, graphs, dashboards, and reports, making it easier for users to comprehend complex datasets.
- Self-service analytics: Users can explore and analyze data independently, reducing the reliance on IT or data professionals like data engineers. This empowers decision-makers to find answers to their questions more quickly.
- Data consistency: The presentation layer ensures that data is presented consistently and uniformly, maintaining a common format and style across the organization.
- Real-time or near real-time updates: Many presentation layer tools allow for real-time or near real-time updates, ensuring that users have access to the most current information.
- Customization: Users can often customize dashboards and reports to tailor the presentation of data to their specific needs and preferences.
Cons:
- Complexity: Developing and maintaining the presentation layer can be complex, especially in large organizations with diverse data sources and a wide range of user requirements.
- Cost: Implementing and supporting presentation layer tools can be costly, as licensing, infrastructure, and maintenance expenses can add up.
- Data security and privacy concerns: Access to sensitive data in the presentation layer can pose security and privacy risks. Ensuring data is only available to authorized users is crucial.
- Training and user adoption: Users may require training to effectively utilize presentation layer tools. Overcoming resistance to change and promoting user adoption can be challenging.
- Performance issues: Slow-loading dashboards or reports can frustrate users. Ensuring optimal performance, especially with large datasets, can be a technical challenge.
- Data overload: Presenting too much data or data that is not relevant to users can lead to information overload, making it challenging to focus on what's essential.
- Maintenance and updates: Regular maintenance and updates are necessary to keep the presentation layer aligned with evolving data sources and user needs.
- Data quality concerns: If the underlying data in the data warehouse is of poor quality, the presentation layer can inadvertently propagate inaccurate or misleading information.
1. Kimball data warehouse design:
- In the Kimball methodology, the presentation layer is typically represented by the data marts. Each data mart is designed to serve the specific reporting and analysis needs of a particular business area or department.
- Data marts are structured to be user-centric, providing a user-friendly interface for business users to access and analyze data.
- Kimball's approach emphasizes dimensional modeling, which makes it easier to present data in a format that aligns with business requirements.
2. Inmon data warehouse design:
- In the Inmon methodology, the presentation layer can be thought of as the enterprise data warehouse (EDW) or the "conformed data layer."
- The EDW serves as a centralized repository of integrated data from various source systems. It can be used to feed data marts or be accessed directly for reporting and analysis.
- Inmon's approach prioritizes data integration and consistency, ensuring that all data in the presentation layer is accurate and aligned with the enterprise's definition of data.
3. Data Vault 2.0:
- In Data Vault 2.0, the presentation layer is represented by the consumption layer. This layer serves as the interface for business users and reporting tools.
- Data Vault 2.0 places a strong emphasis on traceability and auditability, which is also important in the presentation layer for compliance and data lineage purposes.
- The consumption layer provides a structured way to deliver data to end users while maintaining data lineage and governance.
In all these design methodologies, the presentation layer is where data is made accessible to end users and is tailored to meet their specific needs. It acts as a bridge between the raw data in the warehouse and the users who require insights for decision-making.
The choice of design methodology should align with your organization's goals, data structure, and reporting requirements, but the inclusion of a presentation layer is a common and necessary element.
BI tools
In our little project, we have decided to go with Looker - why? There was no particular reason for it - most major BI tools offer similar functionalities.
Integrating a business intelligence (BI) tool like Looker with your presentation layer, which is typically connected to your data mart or warehouse, is a powerful way to enable self-service analytics and reporting for your organization. Here's how Looker can be connected to your presentation layer:
1. Data connection:
Looker can connect to various data sources, including popular data warehouses like Amazon Redshift, Snowflake, Google BigQuery, and more. Ensure that your presentation layer (data mart or warehouse) is supported by Looker.
2. Data modeling:
You can define data models in Looker that represent the datasets and tables in your presentation layer. Looker uses a semantic layer to create a logical data model that simplifies complex data structures for business users.
3. Exploration and analysis:
Business users can explore and analyze data in Looker through a user-friendly interface. Looker's drag-and-drop functionality allows users to build custom reports and dashboards without writing SQL queries.
4. Self-service reporting:
Looker enables self-service reporting, allowing users to create, save, and share their reports and dashboards. This empowers non-technical users to access and analyze data independently.
5. Data governance:
Implement data governance and security measures in Looker to control who has access to specific data and reports. Role-based access control and data permissions ensure data security and compliance.
6. Scheduling and alerts:
Looker allows users to schedule report deliveries and set up alerts based on specific data conditions. Users can receive timely updates when data changes meet predefined criteria.
7. API integration:
Looker offers an API for custom integrations. You can integrate Looker with other tools and applications to automate processes or embed dashboards in external applications.
8. Data drilling and exploration:
Users can drill down into data to explore details, apply filters, and navigate through various dimensions to gain deeper insights.
9. Collaboration:
Looker provides features for collaboration, including commenting on data, sharing insights, and collaborative exploration of datasets.
10. Version control and data lineage:
Looker allows you to track changes to data models and provides data lineage to ensure transparency in data transformations.
By connecting Looker to your presentation layer, you create a streamlined environment for data access and analysis. Looker's capabilities make it easier for business users to derive valuable insights from your data while maintaining data governance and security. This integration facilitates a data-driven culture within your organization.
Check how our data engineering services can help you streamline this process.
Summary
In the realm of data management, the data pipeline architecture assumes a central role, orchestrating the seamless flow of information from diverse sources to actionable insights. Serving as a conduit for data ingestion, transformation, and movement, the data pipeline architecture ensures quality, scalability, and timely availability of data. Its orchestration and automation capabilities streamline complex workflows, integrating various tools and technologies. Crucially, the data pipeline architecture incorporates data validation through frameworks like Great Expectations, fortifying the reliability of the entire process. By embracing data security, scalability, and efficient data movement, the data pipeline architecture becomes a linchpin in facilitating a data-driven culture, empowering organizations to extract valuable insights and make informed decisions.
In addition to its pivotal role in orchestrating data workflows, the data pipeline architecture contributes significantly to cost-saving initiatives. By automating repetitive tasks, the pipeline reduces the need for manual intervention, leading to operational efficiency and resource optimization. Furthermore, it enhances the quality of data, mitigating the potential costs associated with data errors and inconsistencies. The scalability features of the data pipeline architecture ensure that resources are utilized judiciously, accommodating growing data volume without proportional increases in infrastructure costs. Implementing cost-effective solutions within the data pipeline architecture, such as open-source tools and cloud services, further promotes financial efficiency. In essence, a data pipeline not only accelerates data processing but also aligns with cost-conscious strategies, making it a key driver for achieving both operational excellence and fiscal responsibility.


