Debugging hardware description languages (HDL) such as VHDL and Verilog presents unique challenges compared to traditional software debugging. Unlike software, where you can observe the code's behavior directly in real-time, hardware design, described by HDL, cannot be paused or inspected directly due to its inherent parallelism and complex state changes. The focus in HDL development is on examining the descriptions of the hardware rather than the hardware itself.
Debugging in HDL is divided into two main stages: simulation and hardware verification. During the simulation stage, the HDL code is tested in a virtual environment using various testbenches and simulation tools. This stage allows designers to verify the functionality, timing, and behavior of the hardware description under different scenarios without the need for physical hardware. Simulation helps to identify logical errors, timing issues, and unexpected behavior early in the design process, making it easier to correct these issues before moving to the next stage.
Hardware verification, on the other hand, involves testing the synthesized hardware in the physical world. This step ensures that the actual hardware, implemented on FPGAs, operates correctly and meets specifications. In-circuit debugging tools and on-chip debugging resources are used to monitor and analyze the hardware's behavior, providing insights into differences between the simulated and real-world behavior.
Simulation debug techniques
During simulation, HDL offers additional features, allowing it to be run similarly to other software languages. The source code can be executed in a step-by-step mode, allowing observation of signal states at different stages of the simulation. Input signals can be created with any desired time resolution, providing flexibility in testing various scenarios and behaviors of the hardware description. These capabilities enhance the debugging process, allowing designers to analyze and validate the HDL design. Key simulation debug techniques include Test Driven Development (TDD), printf debugging, assertions, and waveform analysis.
Test Driven Development (TDD)
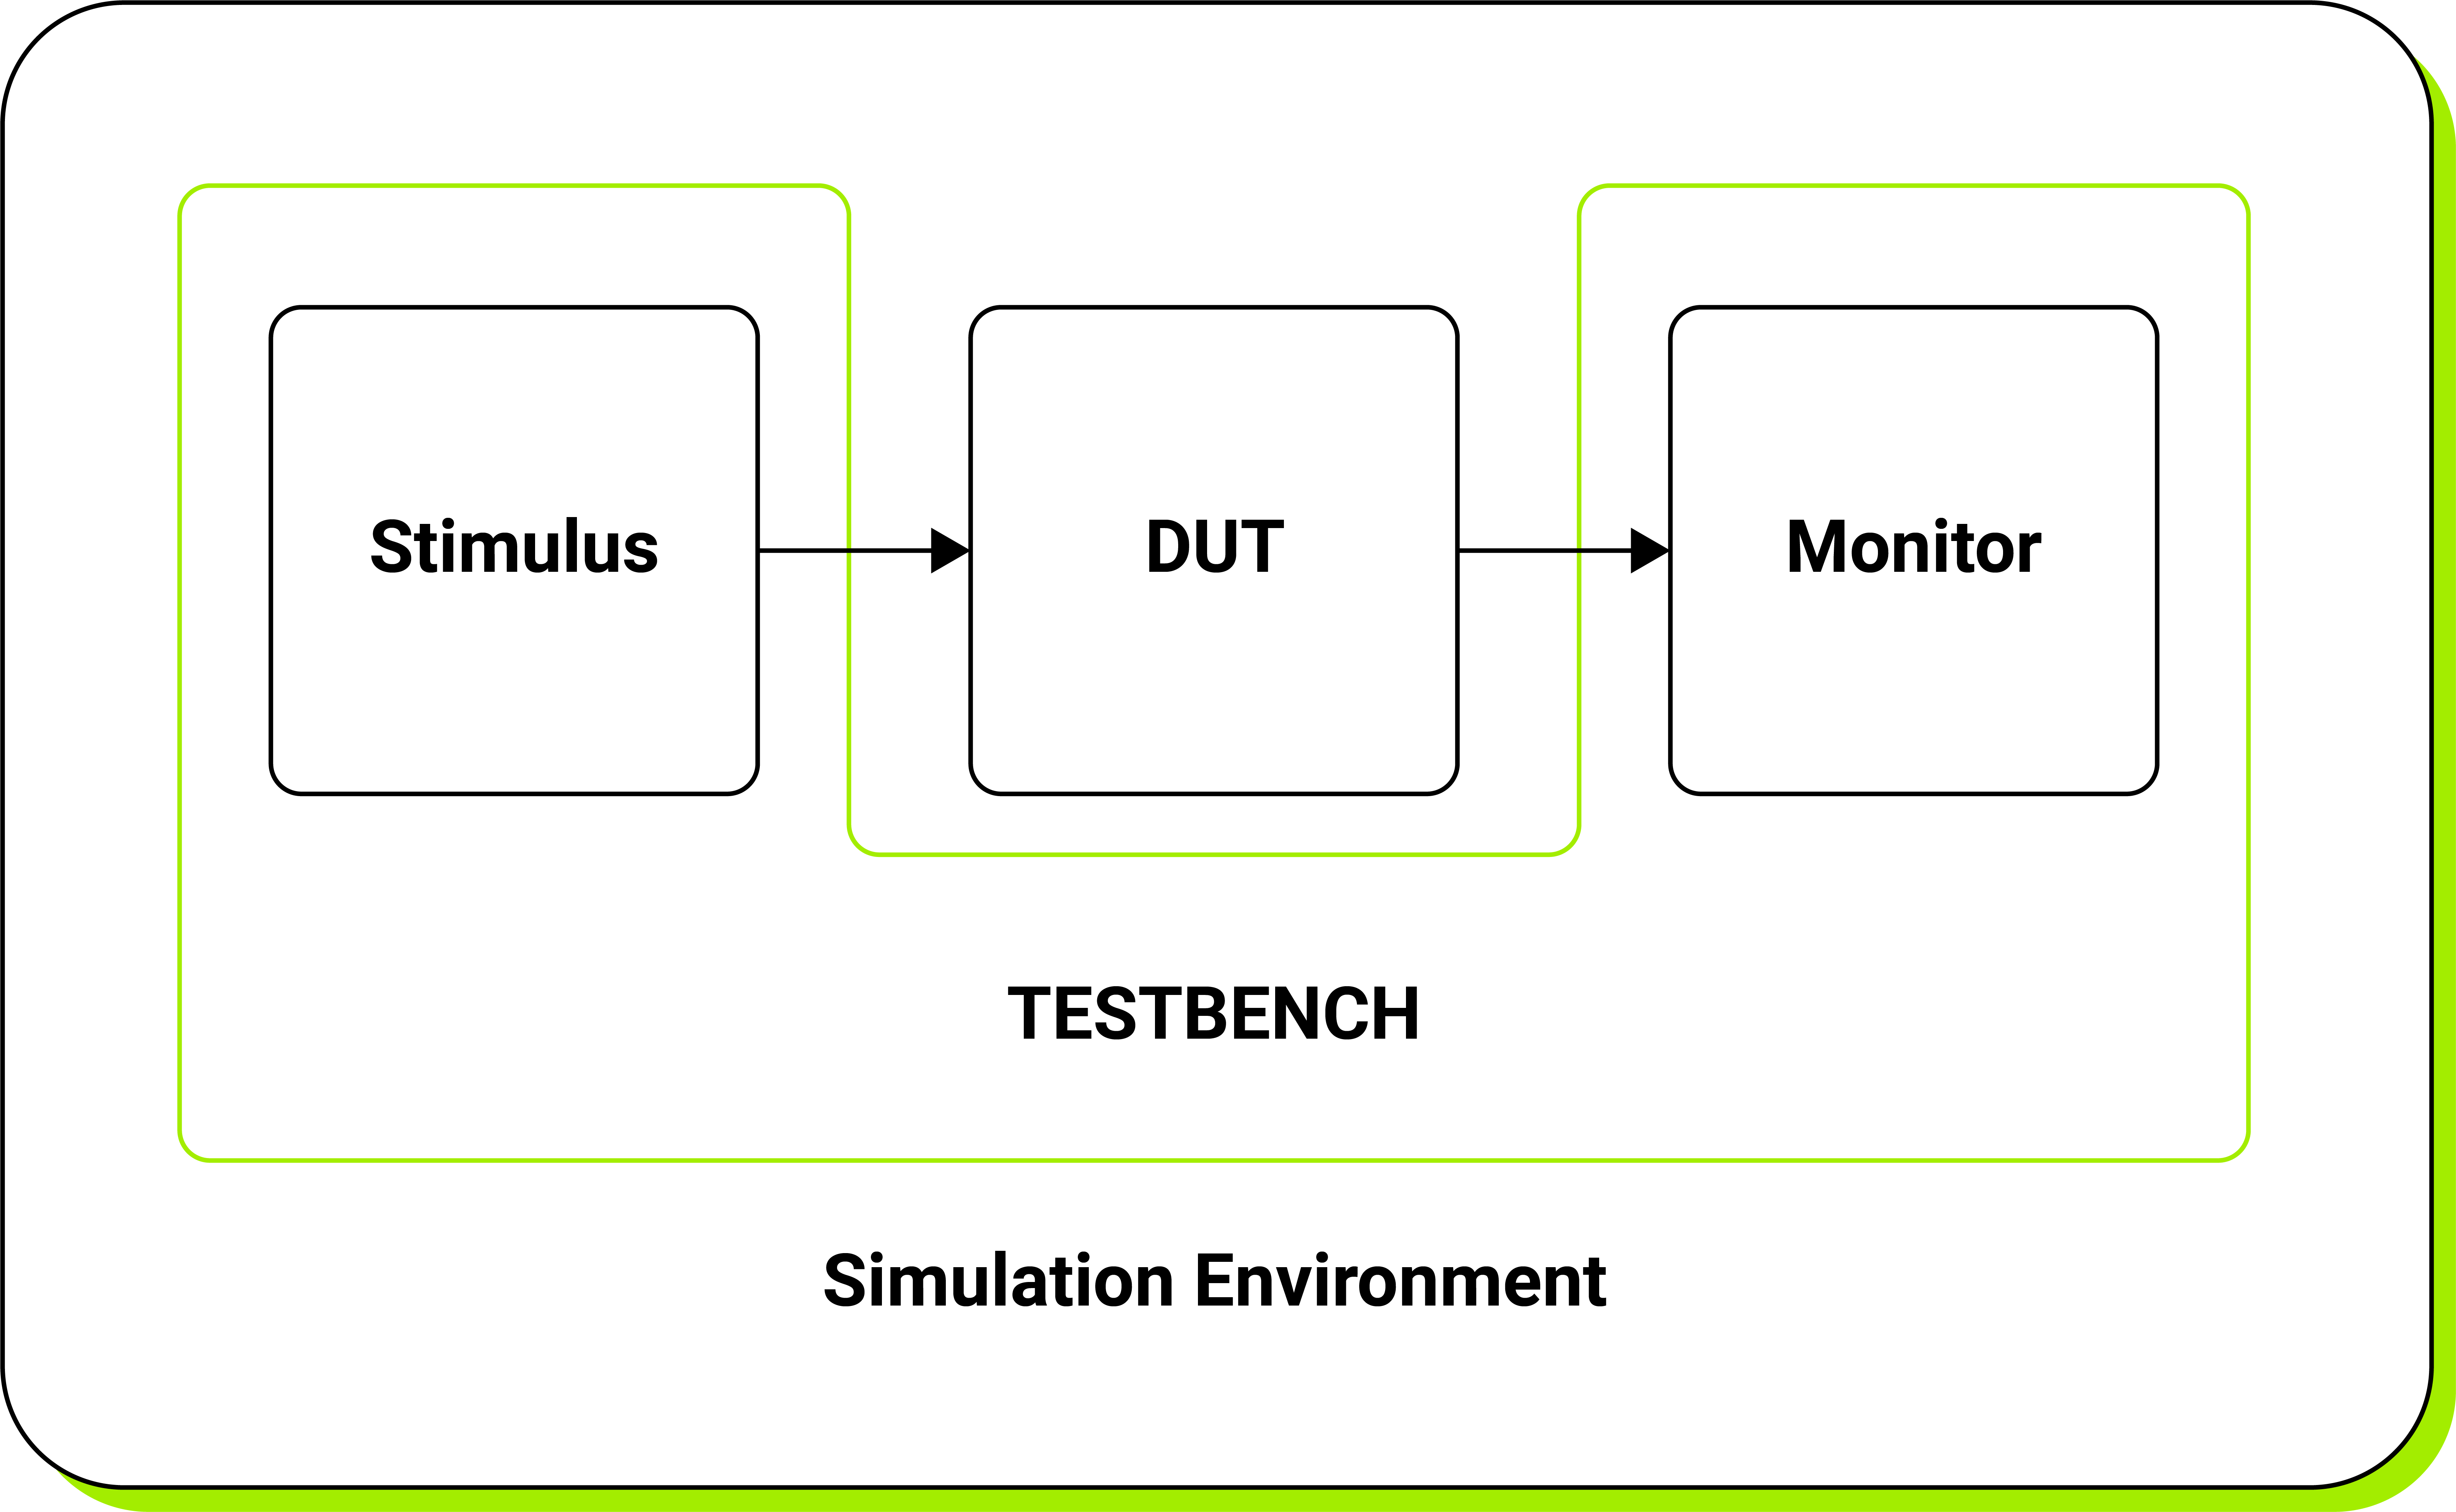
Test Driven Development (TDD) in HDL involves creating a comprehensive testbench environment that generates input vectors intended to validate specific behaviors of the module under test. The testbench serves as a virtual environment where these input vectors are systematically prepared to trigger and verify the desired responses of the module. By designing and executing tests prior to writing the HDL code, developers establish a framework for ensuring the correctness and functionality of the design throughout the development process. This proactive approach not only helps in identifying potential issues early on but also fosters a structured methodology where testing drives the design and implementation process.

Printf Debugging
Printf debugging is also a technique that is possible in HDL development. It allows us to observe and analyze the behavior of the hardware description during simulation. Similar to its use in software development, printf debugging involves inserting print statements in the HDL code or testbench to output the values of signals and variables at specific points in the simulation. This method provides a straightforward way to trace the flow of the simulation and monitor the internal states of the design, allowing the identification of errors and unexpected behavior. Printf debugging provides a mechanism for building logs and gaining a better understanding of the chronological sequence of events within the simulation. It is particularly useful for quickly checking the values of signals and debugging smaller sections of the design.
-- Instantiate the UUT
uut: and_gate port map (
    a => a_tb,
    b => b_tb,
    y => y_tb
);
-- Test process
process
begin
    -- Test case 1
    a_tb <= '0'; b_tb <= '0';
    wait for 10 ns;
    report "Test case 1: a=0, b=0, y=" & STD_LOGIC'image(y_tb);
end process;
Example code for printing text on the console in VHDL.
Assertions
Assertions are statements embedded within the HDL code that specify expected conditions or properties. During simulation, if an assertion fails, it indicates a violation of the expected behavior, helping to identify bugs. Assertions serve as powerful debugging tools by allowing designers to define constraints and check for errors at specific points in the design. Common uses of assertions include verifying signal integrity, ensuring correct state transitions, and validating protocol compliance.
Assert syntax in VHDL:
assert not (Reset = '0' and Set = '0') report "set-reset conflict" severity Failure;

assert result = ExpectedResults report "results differ from expected results" severity Warning;
Severity contains the following values: Note, Warning, Error, and Failure. If the severity clause is omitted, it is implicitly assumed to be an Error.
-- Test process
process
begin
    -- Test case 1
    a_tb <= '0'; b_tb <= '0';
    wait for 10 ns;
    assert (y_tb = '0')
    report "Test case 1 failed: a=0, b=0, expected y=0, got y=" & STD_LOGIC'image(y_tb)
    severity ERROR;
end process;
Example of usage of assert in VHDL
Waveform Analysis
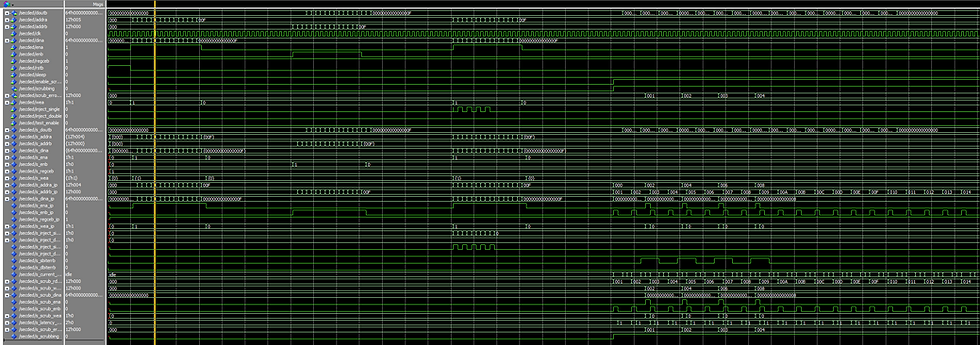
Waveform analysis involves examining the graphical representation of signal states generated by simulation tools over time. This technique allows designers to visualize the behavior of the HDL design and identify differences between the expected and actual behavior. ModelSim, for instance, is an application used for HDL simulation, which provides waveform generation capabilities.
Key aspects of waveform analysis include:
- Signal Tracing: Trace the flow of signals through the design to understand how changes spread and affect other components.
- Timing Analysis: Examine the timing relationships between signals to detect timing violations or performance bottlenecks.
- Comparison: Compare waveforms from different simulation runs or against reference waveforms to identify differences and inconsistencies.
Waveform analysis provides a comprehensive view of the design's dynamic behavior, making it easier to debug complex interactions and timing issues.

Hardware Verification
While simulation provides a virtual environment for testing HDL designs, hardware verification involves testing the synthesized hardware on physical devices such as FPGAs to ensure that it operates correctly in the real world. This stage is crucial for validating the design's functionality, performance, and reliability under real-world conditions.
Internal Oscilloscopes
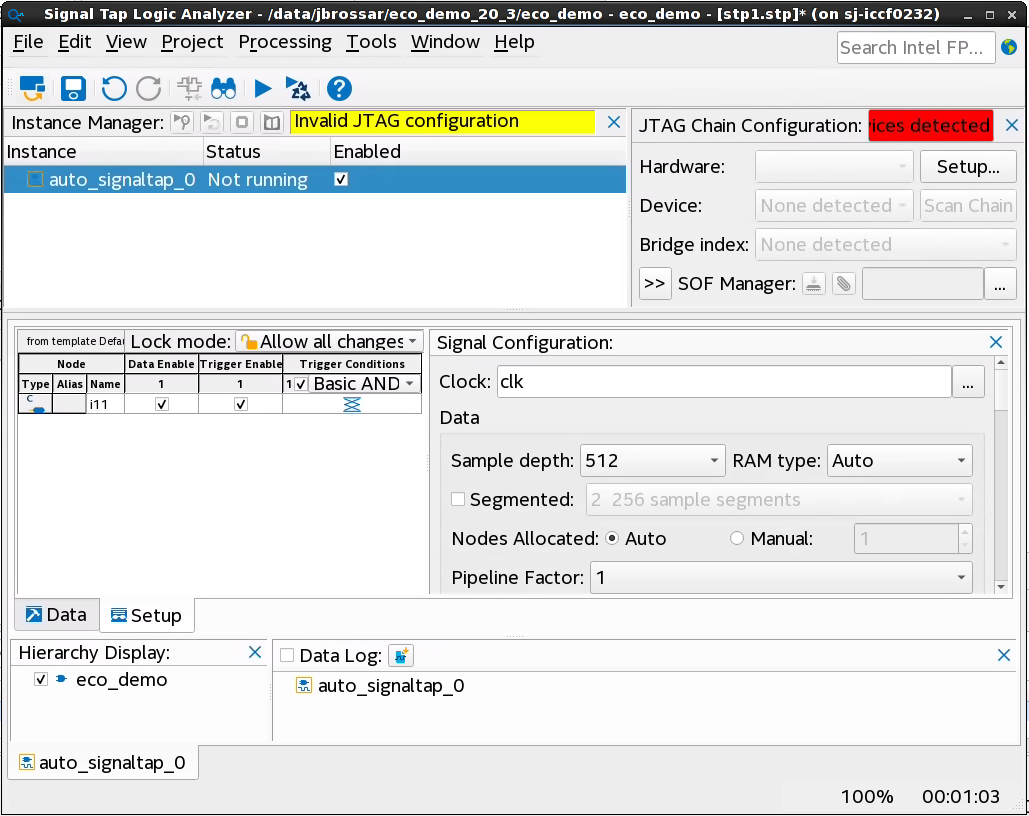
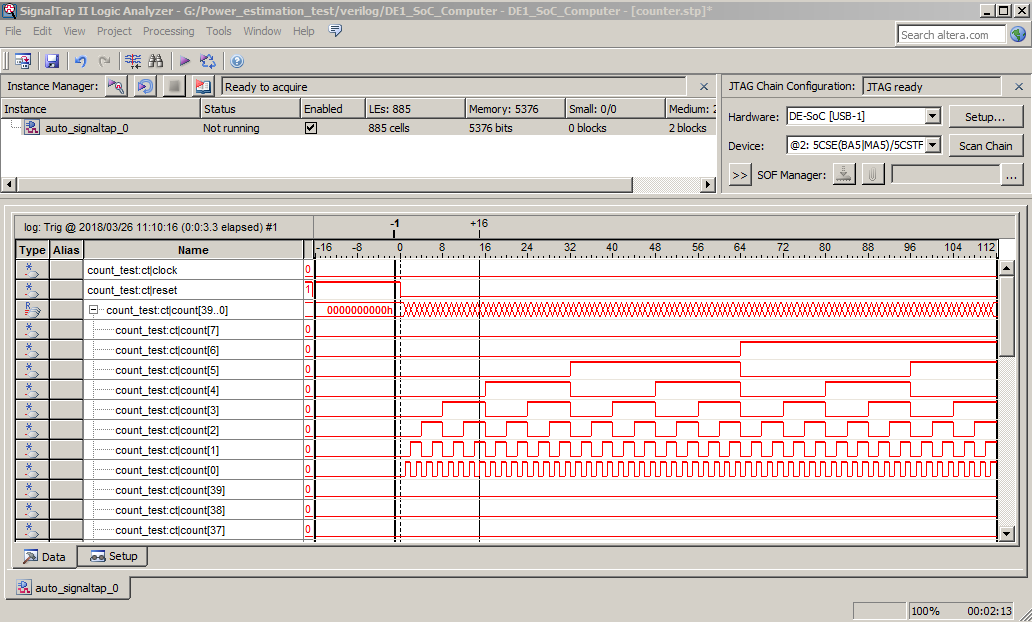
One common method of hardware verification is using internal oscilloscopes, such as SignalTap for Quartus and ChipScope for Xilinx. These internal oscilloscopes leverage the resources of the FPGA to provide customizable signal monitoring capabilities. They allow designers to monitor the behavior of internal signals in real-time without the need for external equipment.
Internal oscilloscopes offer several advantages for hardware verification. They enable designers to observe the behavior of signals at different points within the FPGA, facilitating the identification of timing issues, signal integrity problems, and unexpected behavior. Designers can define the number of probes and sample memory based on the available FPGA resources, providing flexibility in signal monitoring.
However, internal oscilloscopes also have limitations. They consume FPGA resources, which may impact the overall design and routing of signals within the FPGA. Removing the internal oscilloscope or modifying its configuration can affect the connectivity of internal blocks, potentially impacting the functionality of the entire system. Designers must carefully manage FPGA resources to balance signal monitoring requirements with other design constraints.


Debug Registers
Another approach to hardware verification involves the use of debug registers. These registers provide access to important information about the internal state of the module, such as the states of internal state machines, counters of monitored events, or intermediate results of operations between internal blocks. By accessing these registers during runtime, designers can gain insights into the operation of the module and diagnose potential issues.
Debug registers offer several benefits for hardware verification. They provide a convenient way to extract relevant information about the module's behavior without disrupting its operation. Designers can selectively enable debug registers to monitor specific aspects of the module's behavior, allowing for targeted debugging and analysis. Additionally, debug registers consume minimal FPGA resources compared to other debugging techniques, making them suitable for deployment in resource-constrained environments.
However, the effectiveness of debug registers depends on the design's architecture and the availability of suitable interfaces for accessing these registers. Designers must carefully design and implement debug registers within their modules to ensure they provide meaningful debugging information. Additionally, the utilization of debug registers may introduce additional complexity to the design and require careful consideration of trade-offs between debug functionality and resource utilization.
Summary
In summary, debugging HDL involves a combination of virtual simulation and real-world verification. The simulation stage allows designers to ensure that the HDL code is functionally correct while also allowing the use of many debug techniques similar to software development. On the other hand, real-world verification ensures that the HDL description can be accurately realized in physical hardware. By observing samples and signal behaviors directly from the physical device, designers can identify differences between the simulated and actual hardware performance. Combining both simulation and real-world verification ensures the reliability and correctness of hardware designs described by HDL.


