

This article will guide you through a proposition of an implementation of network monitoring and troubleshooting during the Virtual Network Function (VNF) lifecycle, based on a combination of data gathered from SDN - in our case Tungsten Fabric (TF) - and OpenStack. This article is a promised follow up to our article Network traffic troubleshooting during the VNF lifecycle - aspects of Tungsten Fabric flows.
The challenge
In the case presented in this article, the main challenge with network monitoring and proactive troubleshooting is to identify the root cause of potential flow-related errors before they cause a service outage.
This enables delivery of services to continue at pre-defined acceptable levels and eliminates the root cause of potentially disruptive incidents at an early stage. It is crucial from a business continuity management (BCM) perspective and especially important for telecommunication services when five nines availability is required - i.e. your computing infrastructure is working 99.999% of the time; meaning a given service will be unavailable for no more than 5 minutes and 15 seconds a year.
In this article, we guide you through three stages:
- STAGE 1: We describe what kind of data can be collected, and how, using standard OpenStack and Tungsten Fabric APIs and available tools while paying special attention to flow-related information.
- STAGE 2: We go through an example methodology of monitoring flows generated by VMs running in the cloud.
- STAGE 3: We show how to troubleshoot - procedural steps and solutions to minimize or eliminate the effects related to flow resource shortage.
STAGE 1 - Collecting data using standard OpenStack and Tungsten Fabric APIs and available tools
In this stage, we focus on flow monitoring and pay special attention to flow-related information.
In general, the deployment configuration can be obtained from OpenStack and Tungsten Fabric APIs. The control plane operational information can be fetched using appropriate introspection services, while dataplane operational information can be obtained from the vrouter kernel module using NetLink and from the vrouter agent using dedicated command line tools and introspection services. Some dataplane operational status is available through vrouter agent introspection. Dataplane information types available from these sources are in most cases disjoint sets.
The below table lists the most important sources of information about the deployment configuration and operational state of the cloud.
| Source of required bits of information | Information type description |
|---|---|
| OpenStack API | This API will contain configuration and some general operational state information about tenants, stacks, Virtual Machines, hypervisors. Networking-related information is also available through OpenStack API but is fetched via Tungsten Fabric API. Information is available about: - virtual networks - subnets, ports, - addresses, - security groups, - logical routers. |
| Tungsten Fabric Contrail API | This API allows control of the configuration of virtual networks, subnets, ports, addresses, security groups, logical routers, networks, addresses, , BGP peers, and XMPP peers. Most of the Tungsten Fabric API is autogenerated using specification available here: - Contrail API Client - Tungsten Fabric API Client More detailed information on Tungsten Fabric API usage is available here |
| Contrail Analytics API | Analytics data of different kinds is available through the Contrail Analytics API. From a flow-monitoring perspective the most interesting part will be data about historical flows reported by vrouter agents. Note that vrouter agents may be configured with a flow sampling rate, which indicates that analytics will not have information about every flow but only those that appear more frequently. In extreme cases, flow reporting may be disabled during vrouter agent configuration. |
| vrouter | Many kinds of operational data are available in the vrouter kernel module. The most notable one is the entire flow table. Other information stored includes the routing table and MPLS table. Tungsten Fabric uses a standard NetLink channel to write or read this data. In particular, the flow table is written/read in this way. |
| vrouter agent | The vrouter agent implements an introspection interface where all kinds of agent operational states can be viewed. Among others here There are also CLI tools available to verify hypervisor-related networking configuration, as seen by the agent. |
STAGE 2 - An example methodology of monitoring flows generated by VMs running in the cloud
One of the most important tasks when troubleshooting flow table overload-related problems is to find the VMs that are the biggest consumers of the vrouter flow table. Since this information is not immediately available by command or API, data from a few sources must be analyzed and correlated.
The scheme below presents how the data can be obtained and what information is used.
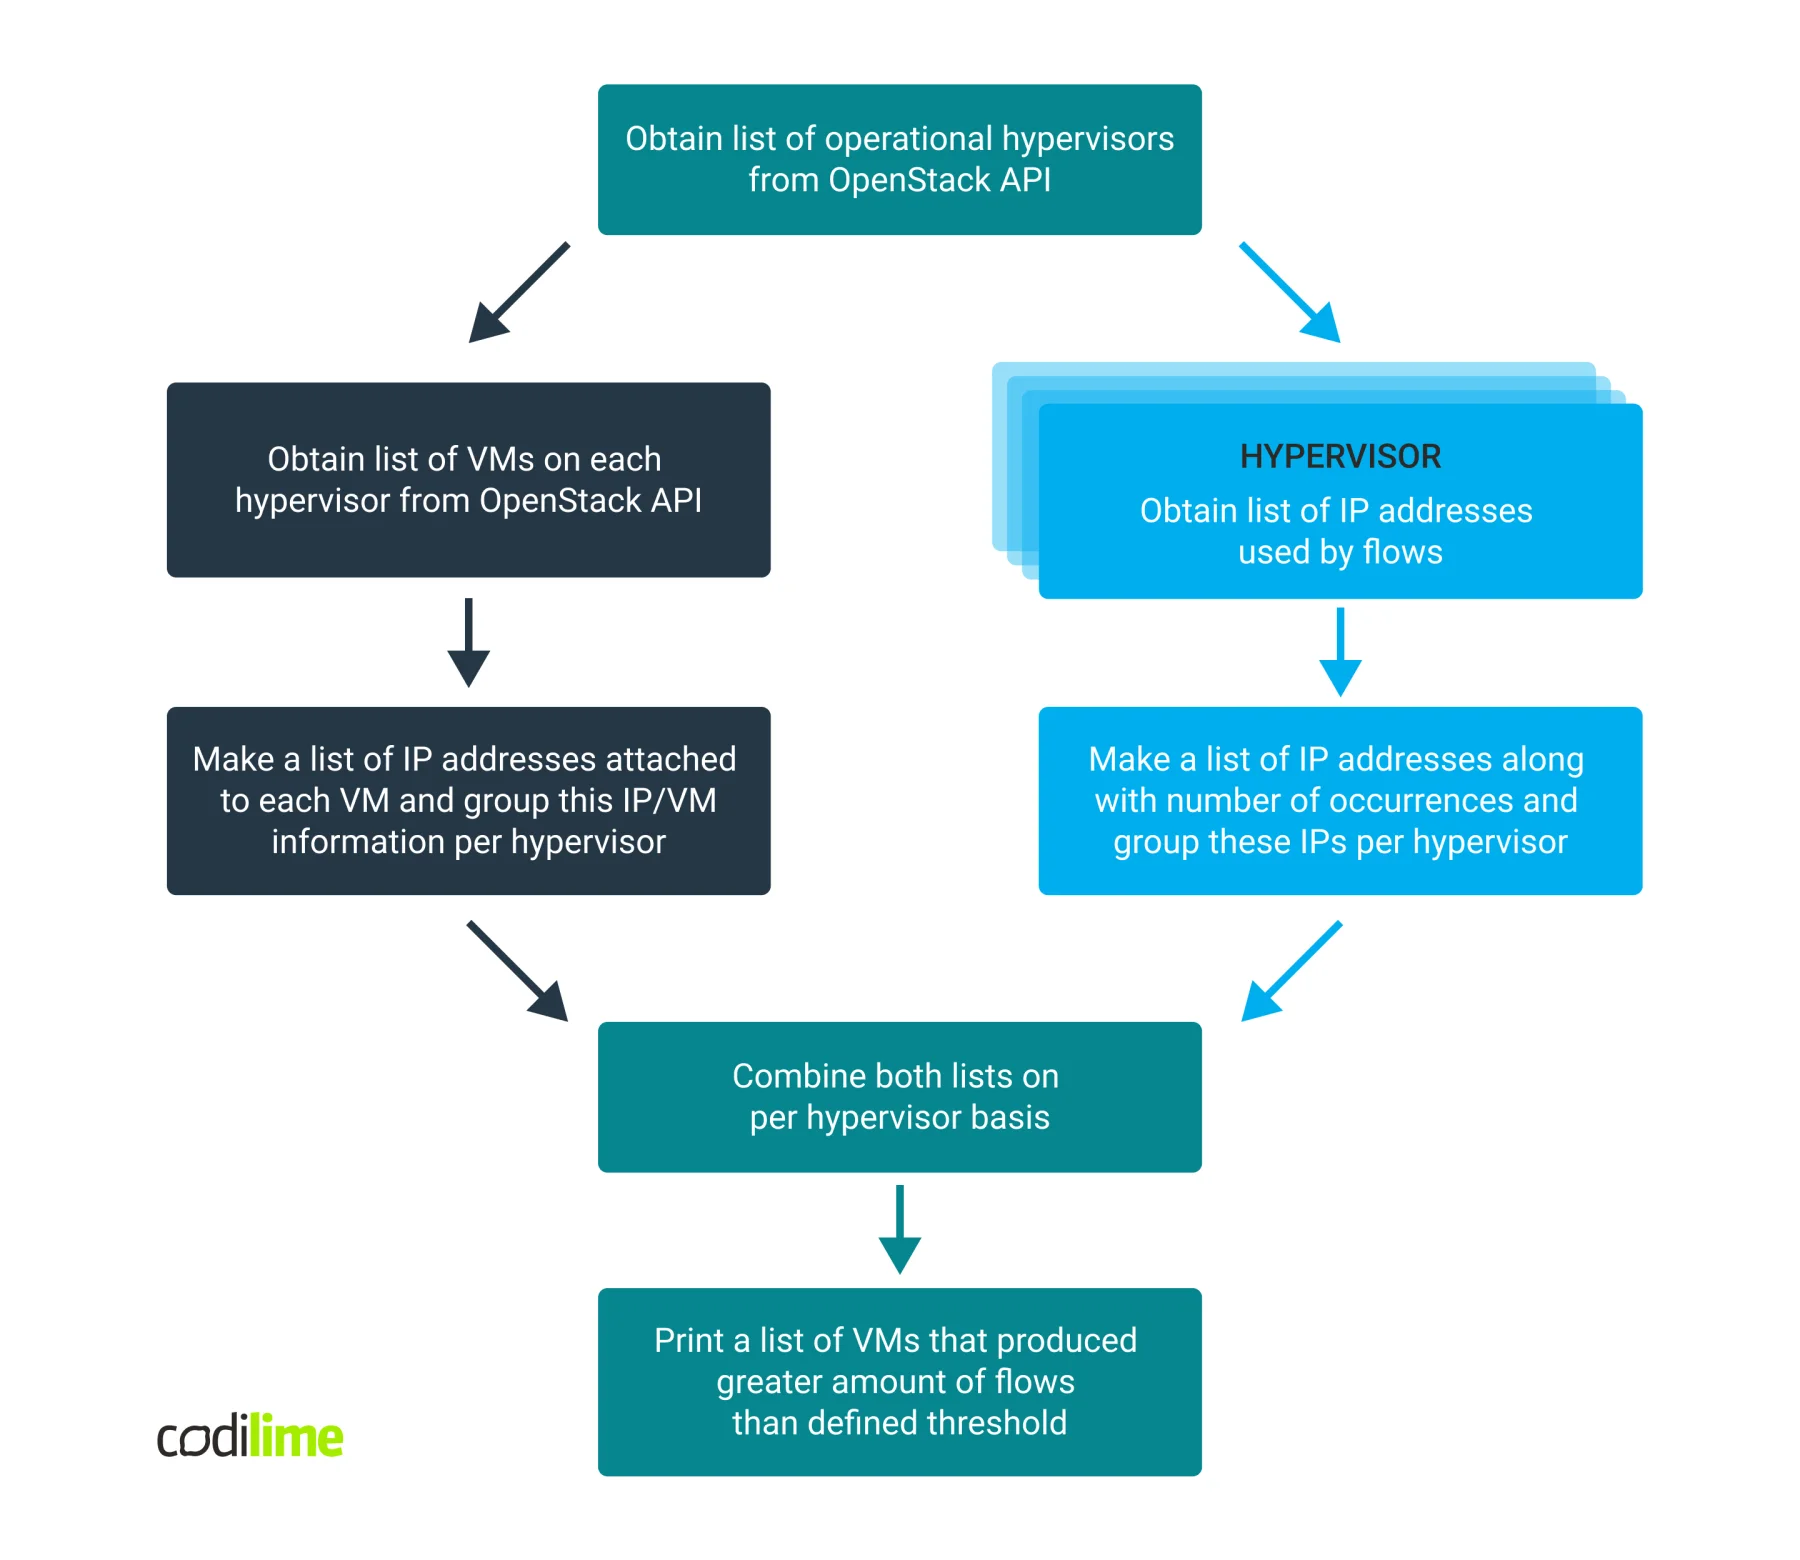
Now, let’s break this down.
The flow command
The most detailed and up to date information about flows is available within the vrouter kernel module on a given hypervisor that, in our case, is known to have problems with the available remaining flow table capacity. Tungsten Fabric comes with a flow utility that uses the NetLink type interface to communicate with the vrouter kernel module and allows us to view the complete flow table with all the flow attributes available. An example flow entry dumped using the flow utility looks as follows:
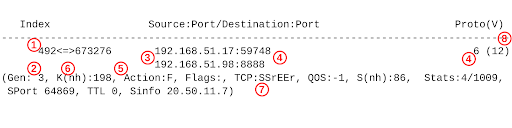
The following table presents the most important flow properties visible on the CLI listing above:
| No | Name | Description |
|---|---|---|
| 1 | Flow index | The flow index (492 in our example) and the reverse flow index (673276). |
| 2 | Generation id | Flow generation id. |
| 3 | IP addresses | Source (192.168.51.17) and destination (192.168.51.98) addresses of the flow. However based on this data we do not know if this flow is ingress or egress from a local VM perspective. Therefore both forward and reverse flows need to be taken into account when searching for the biggest flow consumers among local VMs. |
| 4 | L4 protocol properties | L4 protocol (6 = TCP) used along with port numbers (59748, 8888). |
| 5 | Flow action | Action for the flow (F). |
| 6 | Next hop id | Identifier of the next hop (198) available for this flow (to be used as parameter of the nh command). |
| 7 | Flow state | Flow state (TCP session state in this example: TCP:SSrEEr). |
| 8 | VRF number | VRF number for given flow (12). |
Table 2. The most important flow properties in our example.
Here it is crucial to find all flows in an active state and remember their source and/or destination IP address. It is highly probable that each flow will be bidirectional and will have the reverse flow with src and dst IP addresses swapped. Because this data will be used later to create address occurrence statistics we need to treat flow and reverse flow as a single entity and make sure that the addresses of each entity will not be counted twice. Therefore you can use one of two methods to calculate the number of flows:
- Count the source and destination addresses for forward and reverse flows at the same time and divide the computed statistics by two.
- Consider only the source or destination address field in forward and reverse flow listing during calculations.
Since all virtual networks in Tungsten Fabric are treated as separate entities it may happen that two or more networks with identical addresses may be deployed on the same hypervisor. It is possible that in such a case we find two VMs with the same IP address assigned. However, since we are working on a solution that is supposed to help us quickly pinpoint the biggest flow consumers (among the hundreds or thousands running) for later detailed individual analysis we ignore this fact for the sake of solution simplicity and performance. Moreover, the probability of having two VMs with the same IP address assigned on the same hypervisor is low. In such cases, we just report both VMs with their usage levels added.
The entire flow table may be collected using the flow command. This list will contain the mentioned attributes and can be used to create a list of unique IP addresses coupled with their levels of occurrence. We need to create such statistics for each hypervisor in our deployment. At the end of processing we expect to have a data structure containing the following information:
---
hypervisor1.localcloud:
- ip: 192.168.0.54
  num_flows: '1952'
- ip: 192.168.20.6
  "'num_flows": '993'
- ip: 10.0.10.54
  num_flows: '959'
- ip: 192.168.88.38
  num_flows: '268'
- ip: 10.0.50.224
  num_flows: '238'
...
hypervisor2.localcloud:
- ...
...
The next step is matching the IP addresses found on the hypervisor with the VMs running on it.
The flow utility can also be used to monitor current usage level of flow tables:
hypervisor7 root@hypervisor7:~# flow -r
...
2021-12-12 01:20:57.049:  Entries =     2198 Rate =     37 (Fwd =        7 Rev =        7 Del =        6) Hold =       31 Free Burst Tokens =        0 Total Hold Entries       31
2021-12-12 01:20:57.549:  Entries =     2194 Rate =     80 (Fwd =       15 Rev =       15 Del =       10) Hold =       31 Free Burst Tokens =        0 Total Hold Entries       31
2021-12-12 01:20:58.049:  Entries =     2178 Rate =     97 (Fwd =       18 Rev =       18 Del =       14) Hold =       31 Free Burst Tokens =        0 Total Hold Entries       31
2021-12-12 01:20:58.549:  Entries =     2164 Rate =    100 (Fwd =       15 Rev =       15 Del =       20) Hold =       31 Free Burst Tokens =        0 Total Hold Entries       31
2021-12-12 01:20:59.049:  Entries =     2188 Rate =    101 (Fwd =       25 Rev =       25 Del =        2) Hold =       31 Free Burst Tokens =        0 Total Hold Entries       31
2021-12-12 01:20:59.549:  Entries =     2186 Rate =     66 (Fwd =       14 Rev =       13 Del =        6) Hold =       30 Free Burst Tokens =        0 Total Hold Entries       30
...
This mode of operation will give us information about the current amount of flows allocated and the amount of flows in a hold state (see the “Entries = yyyyy” and “Hold = xx” columns).
The OpenStack API
The OpenStack REST API allows administrators to manipulate the state of the OpenStack cloud. However, using the API directly to achieve that is impractical. Therefore plenty of graphical, CLI and automation tools are available. In our example, we make use of the openstacksdk python library used by the OpenStack client itself. In general, both software packages have logically similar interfaces. That is, commands available within an OpenStack client use a similar set of parameters to corresponding openstacksdk methods. Therefore if you have already worked with the OpenStack client CLI tool, you will find the openstacksdk library quite intuitive.
Our troubleshooting requires two types of information to be fetched from OpenStack API - the list of hypervisors available in the cloud along with their status and whereabouts, and secondly the list of running VMs. For each VM we need to know the list of IP addresses bound to that VM on any of its interfaces and on which hypervisor that VM is running.
Fortunately such information may be obtained with just two API requests:
- Hypervisors
conn = openstack.connect(
          app_name='my_avesome_app',
          app_version='1.0',
          verify=False
      )

hypervisors = conn.compute.hypervisors()
The returned contents look as follows:
[
openstack.compute.v2.hypervisor.Hypervisor(
	status=enabled,
	state=up,
	id=1,
	hypervisor_hostname=hypervisor1.localcloud,
	location=Munch({'cloud': 'envvars', 'region_name': 'RegionOne', 'zone': None, 'project': Munch({'id': '0c6df58e2c26460b91beff7dcdacca3a', 'name': 'admin', 'domain_id': None, 'domain_name': None})})
	),
openstack.compute.v2.hypervisor.Hypervisor(
	status=enabled,
	state=up,
	id=4,
	hypervisor_hostname=hypervisor2.localcloud,
	location=Munch({'cloud': 'envvars', 'region_name': 'RegionOne', 'zone': None, 'project': Munch({'id': '0c6df58e2c26460b91beff7dcdacca3a', 'name': 'admin', 'domain_id': None, 'domain_name': None})})
	),
...
]
The listing contains the hypervisor hostname and its state.
- VMs
[
openstack.compute.v2.server.Server(
	OS-EXT-STS:task_state=None,
	addresses={'test_net1': [{'OS-EXT-IPS-MAC:mac_addr': '02:2f:3c:82:c1:aa', 'version': 4, 'addr': '192.168.0.83', 'OS-EXT-IPS:type': 'fixed'}], 'test_net2': [{'OS-EXT-IPS-MAC:mac_addr': '02:37:62:162:ba:cc', 'version': 4, 'addr': '10.0.10.62', 'OS-EXT-IPS:type': 'fixed'}]},
	links=[{'href': 'https://nova.localcloud:8774/v2/0c6df58e2c26460b91beff7dcdacca3a/servers/69394342-eb98-42f8-a36c-8a402cbc656e', 'rel': 'self'}, {'href': 'https://nova.localcloud:8774/0c6df58e2c26460b91beff7dcdacca3a/servers/69394342-eb98-42f8-a36c-8a402cbc656e', 'rel': 'bookmark'}],
	image={'id': '5658eb38-df75-49b0-860d-d9dda088affb', 'links': [{'href': 'https://nova.localcloud:8774/0c6df58e2c26460b91beff7dcdacca3a/images/5658eb38-df75-49b0-860d-d9dda088affb', 'rel': 'bookmark'}]},
	OS-EXT-STS:vm_state=active,
	OS-EXT-SRV-ATTR:instance_name=instance-00032ab5,
	OS-SRV-USG:launched_at=2021-12-12T12:23:53.000000,
	flavor={'id': '92ae9cc4-283a-4403-af91-36c3803531e7', 'links': [{'href': 'https://nova.localcloud:8774/0c6df58e2c26460b91beff7dcdacca3a/flavors/92ae9cc4-283a-4403-af91-36c3803531e7', 'rel': 'bookmark'}]},
	id=69394342-eb98-42f8-a36c-8a402cbc656e,
	security_groups=[{'name': 'test_net1_sg'}, {'name': 'test_net2_sg'}],
	user_id=10003979814444fab3375f7f443860da,
	OS-DCF:diskConfig=MANUAL,
	accessIPv4=,
	accessIPv6=,
	progress=0,
	OS-EXT-STS:power_state=1,
	OS-EXT-AZ:availability_zone=zone2,
	metadata={},
	status=ACTIVE,
	updated=2021-12-12T14:11:46Z,
	hostId=833c08534d922ba17dd1ec2d9246d1dd074cdb9e38efb4b827c7bff2,
	OS-EXT-SRV-ATTR:host=hypervisor1,
	OS-SRV-USG:terminated_at=None,
	key_name=mvas_keys,
	OS-EXT-SRV-ATTR:hypervisor_hostname=hypervisor1.localcloud,
	name=test_vm, created=2021-12-12T12:23:53.00Z,
	tenant_id=e007305446b54c69bf0f90c4543ddf1a,
	os-extended-volumes:volumes_attached=[],
	config_drive=,
	location=Munch({'cloud': 'envvars', 'region_name': 'RegionOne', 'zone': 'az1', 'project': Munch({'id': 'e007305446b54c69bf0f90c4543ddf1a', 'name': None, 'domain_id': None, 'domain_name': None})})
	),

...
]
The listing above contains all the necessary information: VM name, UUID and attached addresses.
After obtaining a list of active hypervisors we proceed to collect flow information on each of them.
The list of VMs requires some processing. For each hypervisor we need to save a list of VM-assigned IP addresses linked with the VM name and VM UUID. At the end of processing we expect to have a data structure containing the following information:
---
hypervisor1.localcloud:
- ip: 192.168.0.54
  vm_id: 39c26cac-1896-4904-b559-ccc8ac4c4e6c
  vm_name: test_vm2
- ip: 192.168.20.67
  vm_id: 2fbc3af8-ad72-48e9-a10b-89762eba6d6d
  vm_name: test_vm3
- ip: 10.0.50.224
  vm_id: 2fbc3af8-ad72-48e9-a10b-89762eba6d6d
  vm_name: test_vm3
- ip: 192.168.21.63
  vm_id: 2fbc3af8-ad72-48e9-a10b-89762eba6d6d
  vm_name: test_vm3
...
Hypervisor2.localcloud:
- ...
The list of IP addresses found on hypervisor A coupled with the number of their occurrences can now be combined with a list of VMs hosted on the same hypervisor by matching their assigned addresses.
Note that the same methodology may be used to obtain a list of VMs that have the biggest number of flows in a hold state.
STAGE 3 - Troubleshooting procedure steps and solutions to minimize or eliminate root causes
The troubleshooting procedure has the following steps:
- Find hypervisors where the problem occurs - either those with little or no available flow table space or those with the hold flow limit reached. This may be achieved with just one command, similar to the Linux network troubleshooting commands.
- For each affected hypervisor, use the described procedure to obtain the list of VMs that contribute most to the problem. In most cases it is a single VM or a group of VMs implementing some common functional block - meaning that they belong to the same tenant.
- The next step depends on the VNF itself. Here, you can find how to minimize the effect based on different scenarios:
Flow table extinction
Impact:
- Performance drop - more hash collisions as the main flow table is utilized more and, as a consequence, the overflow table becomes busier (searching the overflow table is far more demanding of CPU resources).
- If the flow table is full, then the flow is marked as short-flow (to be deleted). This means that any new communication is likely to be immediately dropped.
How to minimize the effect:
- Depending on the traffic type (but especially for stateless traffic) a good practice would be to adjust the flow aging timers, so that flows are deleted after a shorter period of inactivity. The stateful traffic-TCP flows will be deleted automatically because the TCP session state is being tracked by vRouter Agent.
- Increase the size of the flow and overflow tables (this may be a reason to considerably increase memory requirements).
- If the cause of the problem is a single VM (or a small group of VMs) it may be beneficial to configure the per-VM flow count limit.
- Configure fat flows, bundling similar types of flows within the same flow entry. This type of configuration must take into account the specifics of the VNF to make sure that fat flow configuration will not affect the operation of the virtual network function.
- If applicable, configure packet mode on the VMIs belonging to the biggest flow consumers.
Hold flow table extinction
Impact:
- Communication disruption - most new flows cannot be established for any VM that uses a given hypervisor.
How to minimize the effect:
- Attempt to locate VMs that contribute most of the new flows and check whether it is possible to reconfigure the application to decrease the rate of new flows.
- Increase the hold flow count limit.
- Configure a per-VM flow limit that is smaller than the hold flow count limit. While this will not solve problems with a particular VM generating a high rate of new flows, it will allow other VMs to resume normal operation.
- If applicable, configure the packet mode on the VMIs belonging to the biggest flow consumers.
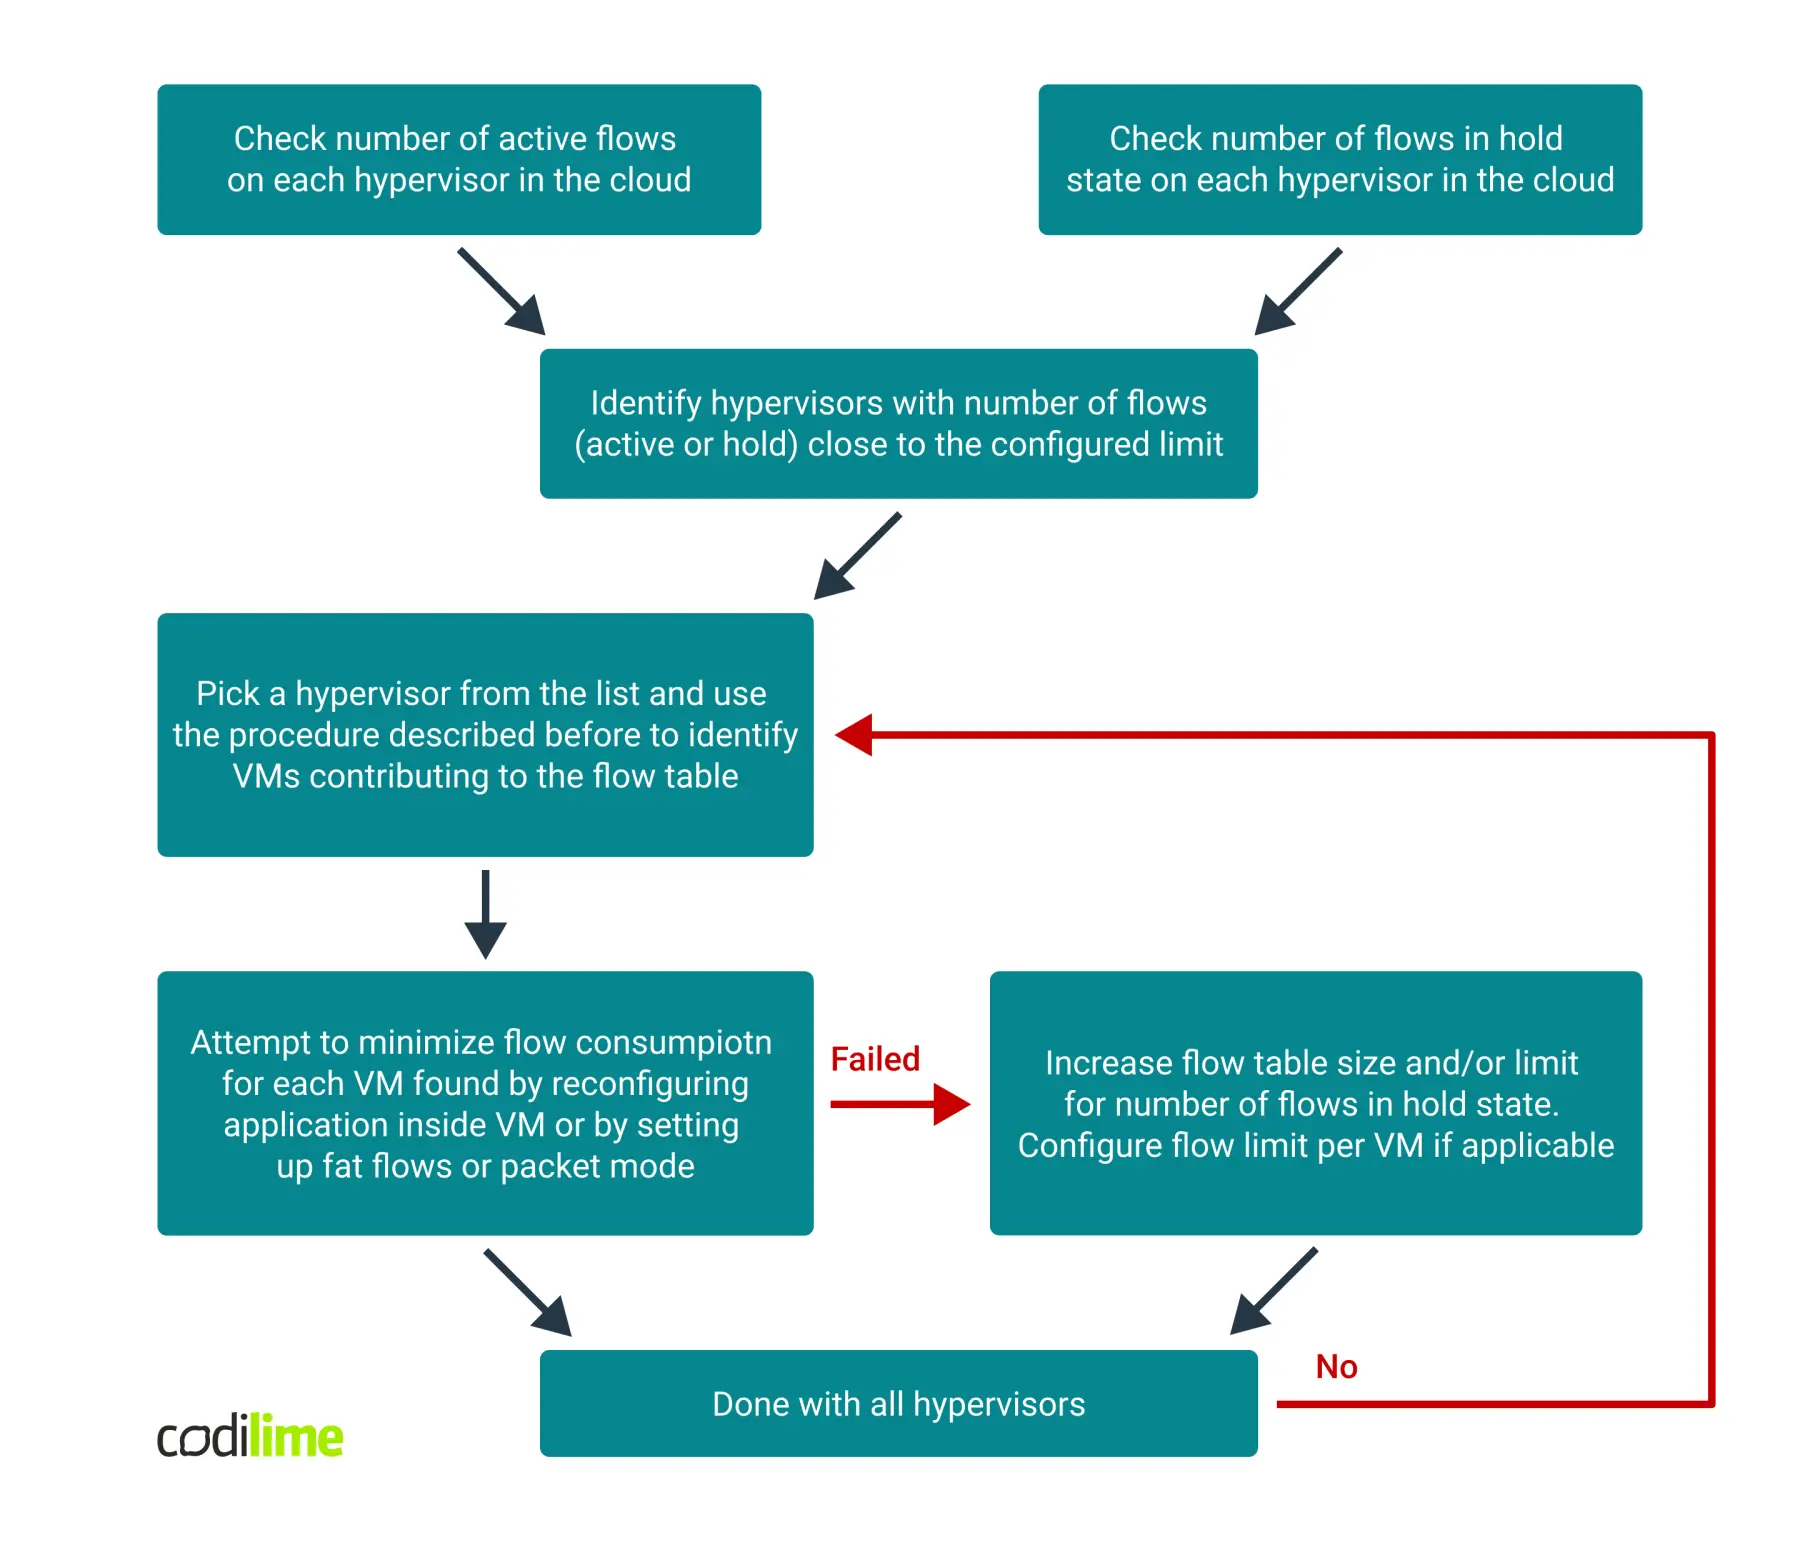
The scheme below shows the steps you should follow to find the biggest flow consumers and reduce or eliminate their impact on cloud operation.
Conclusion
In this post, we have described how you can detect and verify the problem of a high number of flows in the system. Indeed, in the production environment where everything is dynamic and a lot of changes happen every minute, it is crucial to be able to identify the source of a problem in order to solve it.
The issue described above is one that can happen in real-life networks and may be difficult to detect or identify when you don’t know what to look for. The procedure shows how to address the issue if you suspect that flow consumption may be the problem. The step by step description guides you through the detection process and proposes mitigation actions to limit the impact.
>> Check out our network professional services.


