


Concepts of the instrumentation, observability, and monitoring of a computing system are interrelated and essential for managing the operational complexity of modern cloud-native applications. By leveraging OpenTelemetry for instrumentation, you can address observability concerns in your application while keeping the implementation vendor neutral and choose monitoring or distributed tracing systems later. A non-exhaustive list of OpenTelemetry vendors ![]() who natively support OTLP (OpenTelemetry protocol) is available and can be used to make those decisions easier.
who natively support OTLP (OpenTelemetry protocol) is available and can be used to make those decisions easier.
Observability, monitoring, and instrumentation primer
Observability in computing refers to the ability to understand and analyze the internal state of a system by observing its outputs or behaviors. Monitoring involves actively observing the performance and health of the system by collecting predefined metrics such as CPU usage, memory consumption, response times, and error rates. Instrumentation refers to the incorporation of code or agents into a computing system to gather relevant data in the form of traces, metrics, and logs (also known as telemetry data).
Here is how observability and monitoring relate to the instrumentation process:
- Instrumentation is the foundation
It provides raw data about the system's behavior. This data can include function execution times, memory usage, response times, and error rates. - Observability is the ability to see
With the data from instrumentation, you can gain observability into your system. It means you can understand the inner workings, identify issues, see how it responds to changes, and handle novel problems (i.e. "unknown unknowns"). - Monitoring puts it all together
Monitoring tools or platforms take the data from instrumentation and present it in a way that's easy to analyze and understand. They can provide dashboards, alerts, reports that help you keep track of your system's health and performance, as well as tools to perform distributed tracing analysis.
Proper instrumentation enables not only monitoring but also proactive problem-solving by providing real-time visibility into system behavior, allowing for timely interventions and optimizations. Ultimately, the ability to observe and comprehend system dynamics is essential for maintaining system health, improving user experience, and driving innovation in the ever-evolving landscape of cloud computing.
Signals in OpenTelemetry
Generally, instrumentation is about adding code or agents to a system to generate and emit telemetry data. In OpenTelemetry, signals are categories of this data. These signals provide a standardized approach for collecting and transmitting telemetry data within distributed systems and include metrics, logs, traces, and baggage (contextual information passed between signals), which are collected, processed, and exported.
- Logs refer to structured records of events or messages generated during the execution of an application. Logs typically contain relevant information such as timestamps, severity levels, contextual data, and user-defined attributes.
- Metrics are quantitative measurements that provide insights into the behavior and performance of a system over time. These measurements represent various aspects of a system, like resource utilization, error rates, throughput, and latency.
- Traces represent the end-to-end journey of a request as it traverses through various components of a distributed system. It consists of a sequence of interconnected spans, each representing a unit of work or activity within the system. Spans capture relevant information such as start and end times, duration, and contextual metadata related to the operation performed.
Different signals can be correlated to improve understanding of the inner workings of a system. There is also an ongoing initiative within the Profiling Working Group to include profiles signal to the specification - those profiles will be especially useful in correlation with other signals. More details can be found in the Propose OpenTelemetry profiling vision ![]() document.
document.
Instrumentation in OpenTelemetry
There are two primary ways to instrument an application or a distributed system in OpenTelemetry in order to collect, process, and export signals:
- The Zero-code method leverages libraries and integrations offered by the OpenTelemetry ecosystem that automatically instrument supported frameworks, libraries, and protocols. This approach requires minimal manual intervention. The instrumentation is applied transparently to the underlying components of the application. Automatic instrumentation helps developers quickly gain observability without modifying application code extensively or at all.
- The Code-based method when developers can manually instrument their code using the OpenTelemetry API. This approach requires explicitly adding instrumentation code to functions or components within the application. Manual instrumentation provides flexibility and fine-grained control over what telemetry data to capture and how to annotate it.
When developing a library the author can consider adding OpenTelemetry instrumentation using a code-based approach. Such a library can then be added to the OpenTelemetry Registry ![]() and become part of the ecosystem. This way, developers using the library can set up a zero-code instrumentation and leverage it in their own observability systems.
and become part of the ecosystem. This way, developers using the library can set up a zero-code instrumentation and leverage it in their own observability systems.
Kubernetes cluster setup for observability with OpenTelemetry
Before exploring examples of different instrumentation methods available in OpenTelemetry, let's set up our Kubernetes-based testing environment.
We will utilize minikube as our demo cluster alongside the OpenTelemetry collector and Jaeger, a distributed tracing platform, deployed on it. Furthermore, we'll leverage Kubernetes operators to ensure a seamless deployment of the OpenTelemetry collector and Jaeger platform.
Firstly, we start our cluster and install cert-manager (a prerequisite for both operators).
$ minikube start --cpus=8 --memory 16384 --disk-size 32g
$ kubectl apply -f https://github.com/cert-manager/cert-manager/releases/download/v1.14.4/cert-manager.yaml
Secondly, install the operators following the documentation for OpenTelemetry Operator ![]() and Jaeger Operator
and Jaeger Operator ![]() .
.
$ kubectl apply -f https://github.com/open-telemetry/opentelemetry-operator/releases/download/v0.96.0/opentelemetry-operator.yaml

$ kubectl create namespace observability
$ kubectl create -f https://github.com/jaegertracing/jaeger-operator/releases/download/v1.54.0/jaeger-operator.yaml -n observability
We now have operators installed and ready to take care of deploying the OpenTelemetry collector and Jaeger. For this we need to create resources consumed by operators.
$ kubectl apply -f - <<EOF
apiVersion: jaegertracing.io/v1
kind: Jaeger
metadata:
  name: demo-jaeger
EOF
This instructs the Jaeger operator to deploy the simplest all-in-one pod with all components for Jaeger. Next, we need to instruct the OpenTelemetry operator to deploy the collector.
$ kubectl apply -f - <<EOF
apiVersion: opentelemetry.io/v1alpha1
kind: OpenTelemetryCollector
metadata:
  name: demo-otel
spec:
  config: |
    receivers:
      otlp:
        protocols:
          grpc:
            endpoint: 0.0.0.0:4317
          http:
            endpoint: 0.0.0.0:4318
    processors:
      memory_limiter:
        check_interval: 1s
        limit_percentage: 75
        spike_limit_percentage: 15
      batch:
        send_batch_size: 10000
        timeout: 10s

    exporters:
      otlp:
        endpoint: demo-jaeger-collector:4317
        tls:
          insecure: true

      debug:

    service:
      pipelines:
        traces:
          receivers: [otlp]
          processors: [memory_limiter, batch]
          exporters: [debug, otlp]
        metrics:
          receivers: [otlp]
          processors: [memory_limiter, batch]
          exporters: [debug]
        logs:
          receivers: [otlp]
          processors: [memory_limiter, batch]
          exporters: [debug]
EOF
This configuration makes sure that Traces are exported using OTLP to a simple Jaeger collector. Now we can check the status of the pods in the default namespace.
$ kubectl get pods
NAME                                   READY   STATUS    RESTARTS   AGE
demo-jaeger-b88cc9658-gc25l            1/1     Running   0          113m
demo-otel-collector-5bf9dcb48f-j6qsf   1/1     Running   0          111m
Adding port-forwarding for the Jaeger UI will give us access to the distributed tracing system over localhost:166686.
$ kubectl port-forward svc/demo-jaeger-query 16686:16686
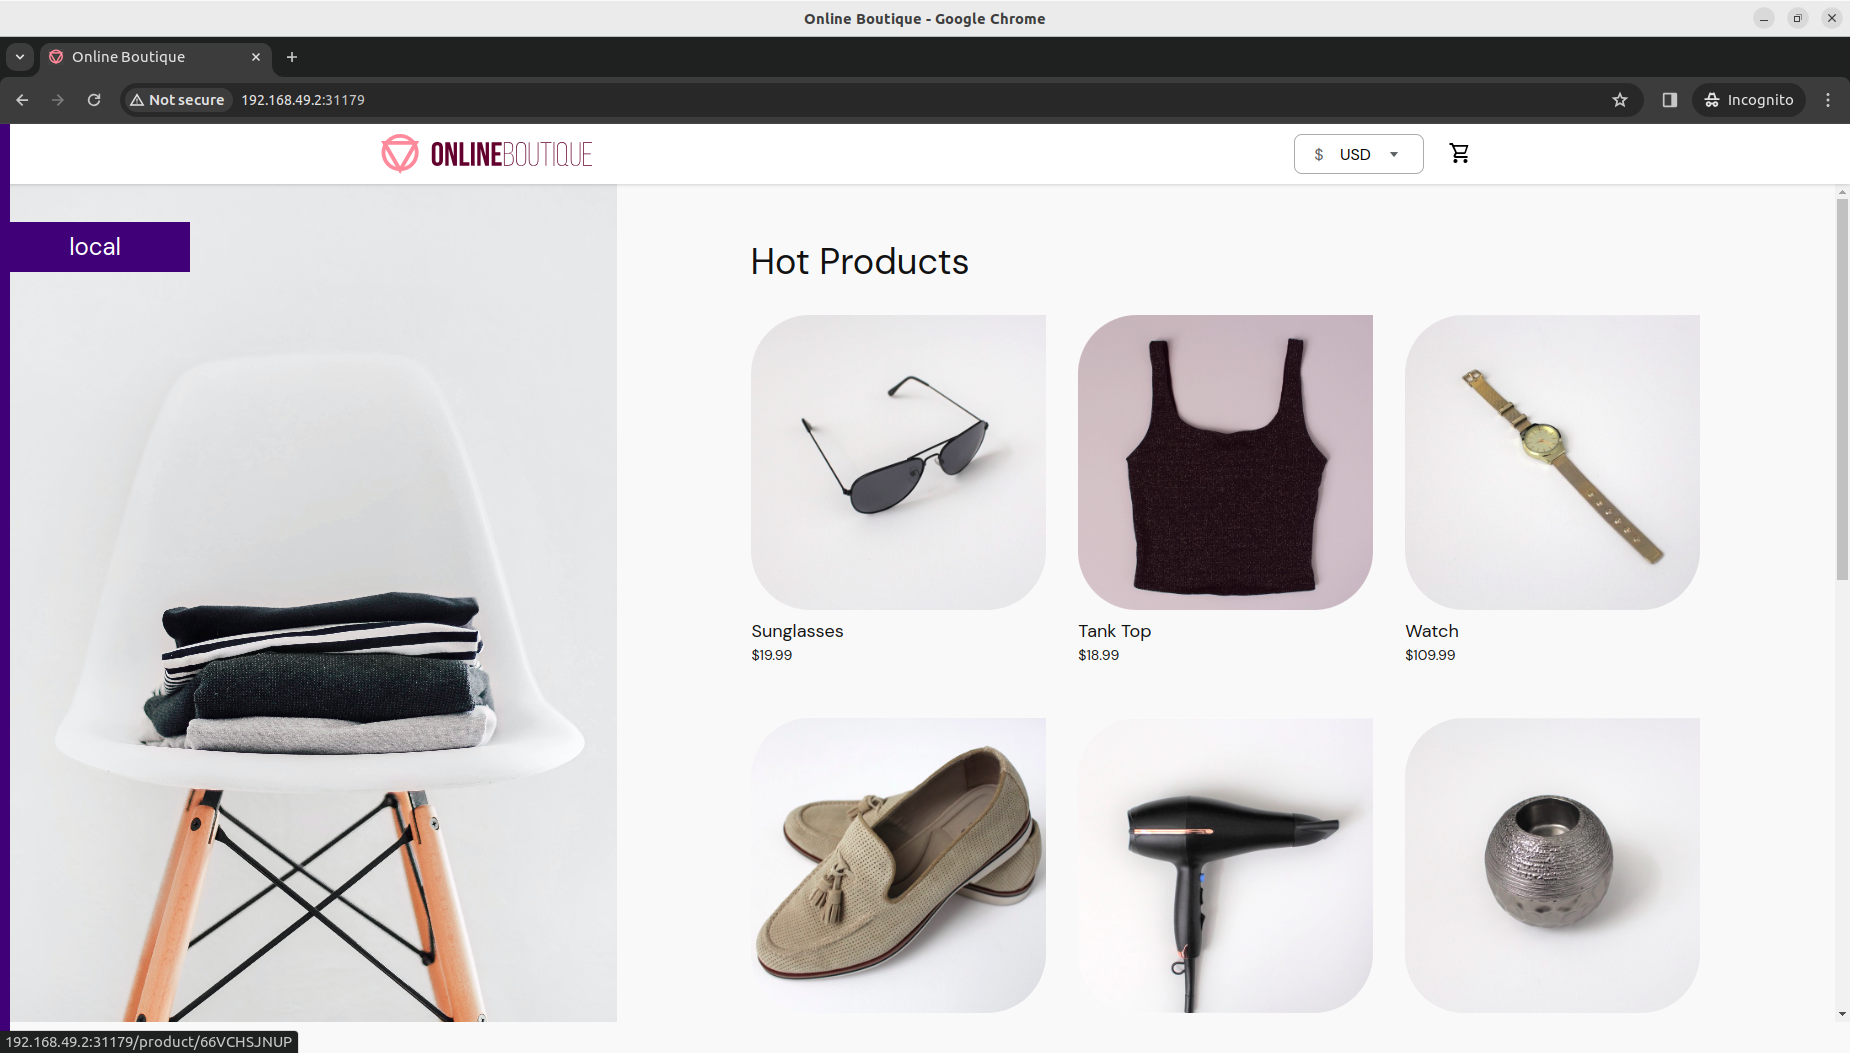
For a complete demo, we need a system to build observability into. The Online Boutique sample cloud-first application with 10 microservices meets our requirements. Once deployed with instrumentation integrated, it will emit signals (and especially traces used by Jaeger) which will be received by OpenTelemtry Collector, processed, and exported to Jaeger for distributed tracing analysis.
$ git clone -b v0.9.0 --depth 1 https://github.com/GoogleCloudPlatform/microservices-demo.git
$ cd microservices-demo/
$ skaffold run
$ minikube service –all
At this point, we should be able to access the Online Boutique sample application and try to choose and order some items from the store.
Crucially, we can check that the system does not emit any signals, resulting in the absence of TracesExporter or MetricsExporter logs in the OpenTelemetry collector's logs.
$ kubectl logs -f -l app.kubernetes.io/name=demo-otel-collector
[...]
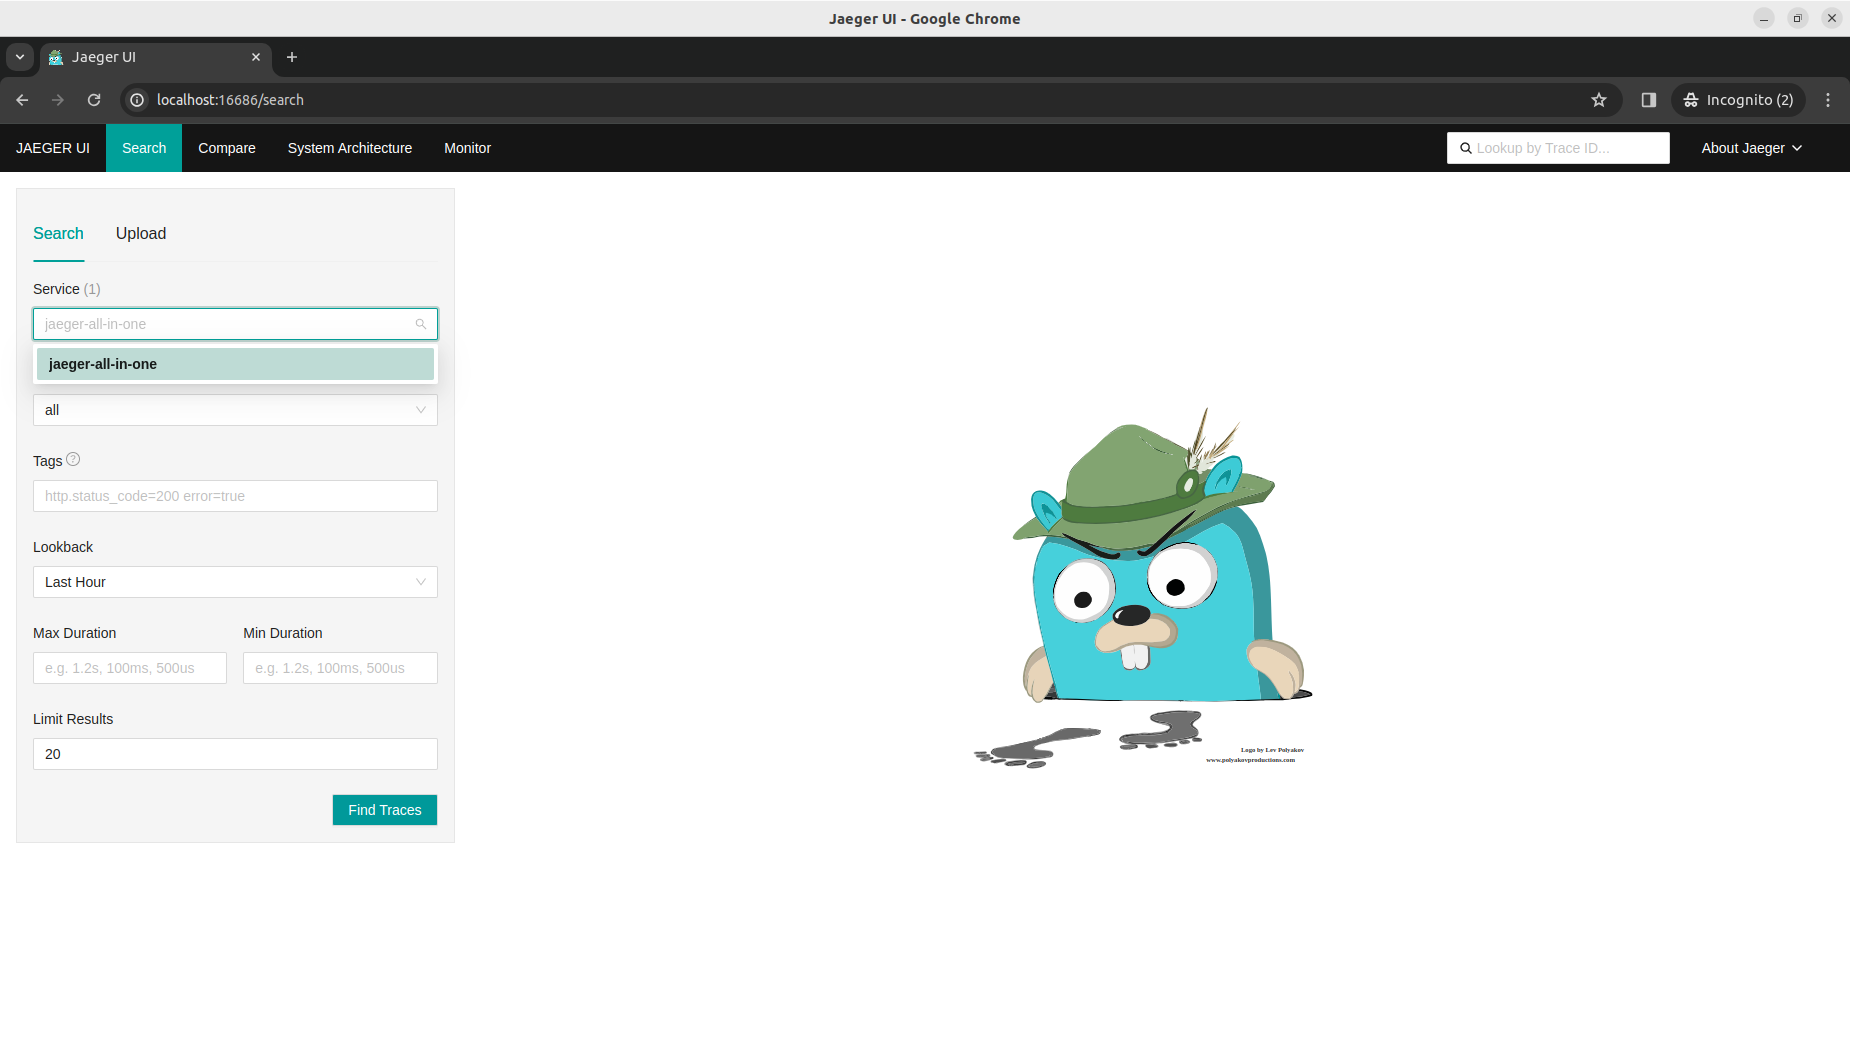
In the absence of any systems, services in the distributed tracing platform are accessible via Jaeger UI.
Zero-code instrumentation
Typically, zero-code instrumentation adds instrumentation for the libraries you're using. This means that requests, responses, database calls, message queue calls, and so forth are instrumented. This approach is especially useful when you want to improve observability in an existing system, as well as a starting point for building an observability subsystem during the product/application development phase.
Let's apply Python auto-instrumentation to Python services deployed in the default namespace. Firstly, we need to create an Instrumentation resource that will be used by the OpenTelemetry operator to configure auto-instrumentation for the services in pods.
$ kubectl apply -f - <<EOF
apiVersion: opentelemetry.io/v1alpha1
kind: Instrumentation
metadata:
  name: demo-python-instrumentation
spec:
  exporter:
    endpoint: http://demo-otel-collector:4318
  propagators:
    - tracecontext
    - baggage
  sampler:
    type: parentbased_traceidratio
    argument: "1"
EOF
Secondly, we annotate the default namespace to ensure that any new pod (re-)deployed will be annotated for Python auto-instrumentation.
$ kubectl annotate namespace/default instrumentation.opentelemetry.io/inject-python="true"
Auto-injection leverages Kubernetes Init Containers ![]() to patch Python services containers with an agent that attaches to any Python application and dynamically injects bytecode to capture telemetry from libraries and frameworks.
to patch Python services containers with an agent that attaches to any Python application and dynamically injects bytecode to capture telemetry from libraries and frameworks.
Now we can re-deploy the relevant Python services so that OpenTelemetry can apply automatic instrumentation to them.
$ kubectl delete pod -l app=recommendationservice
$ kubectl delete pod -l app=emailservice
The annotation would also cause non-Python services to be auto-injected with a Python agent, so a proper solution would be to annotate only the relevant services.
Once the services/pods are running again TracesExporter and MetricsExporter OpenTelemetry collector logs should be present.
$ kubectl logs -f -l app.kubernetes.io/name=demo-otel-collector
[...]
2024-03-21T23:08:49.428Z	info	MetricsExporter	{"kind": "exporter", "data_type": "metrics", "name": "debug", "resource metrics": 1, "metrics": 20, "data points": 664}
2024-03-21T23:08:49.489Z	info	TracesExporter	{"kind": "exporter", "data_type": "traces", "name": "debug", "resource spans": 4, "spans": 8}
2024-03-21T23:08:59.490Z	info	TracesExporter	{"kind": "exporter", "data_type": "traces", "name": "debug", "resource spans": 4, "spans": 8}
2024-03-21T23
:09:09.430Z	info	MetricsExporter	{"kind": "exporter", "data_type": "metrics", "name": "debug", "resource metrics": 2, "metrics": 42, "data points": 1332}
2024-03-21T23:09:09.491Z	info	TracesExporter	{"kind": "exporter", "data_type": "traces", "name": "debug", "resource spans": 4, "spans": 8}
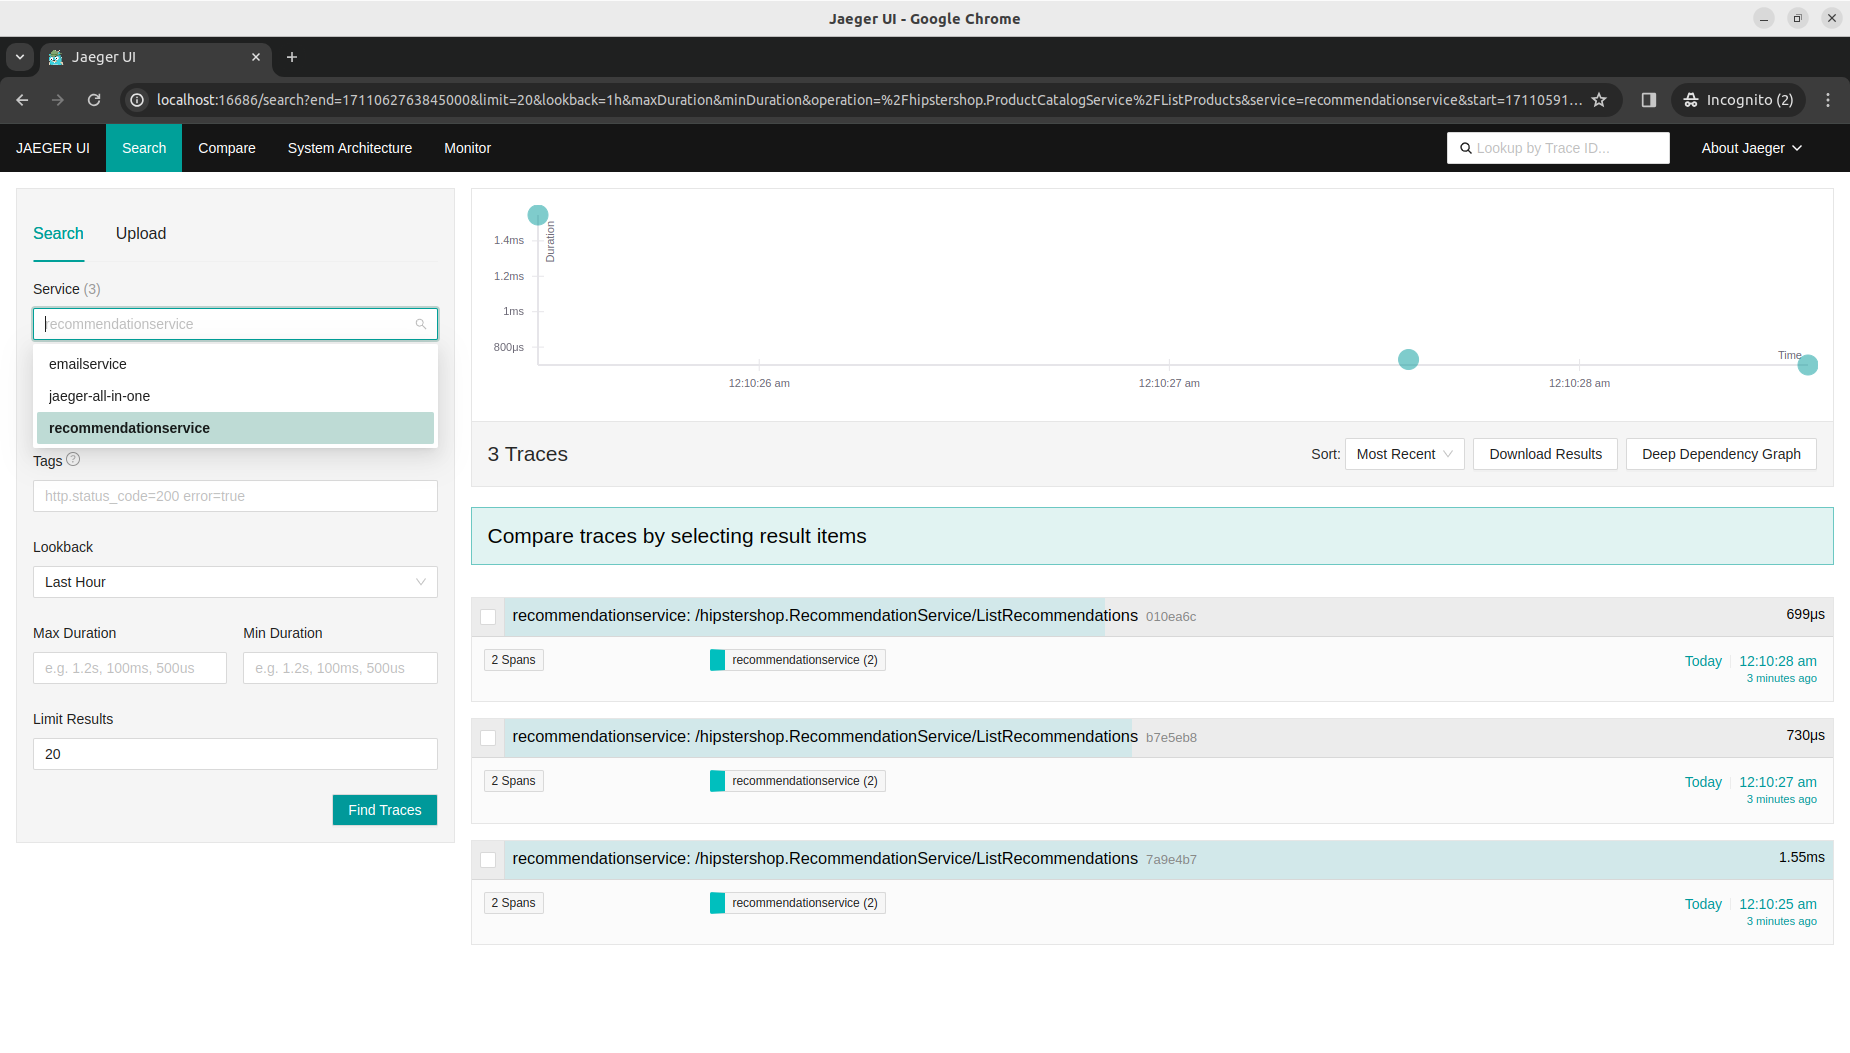
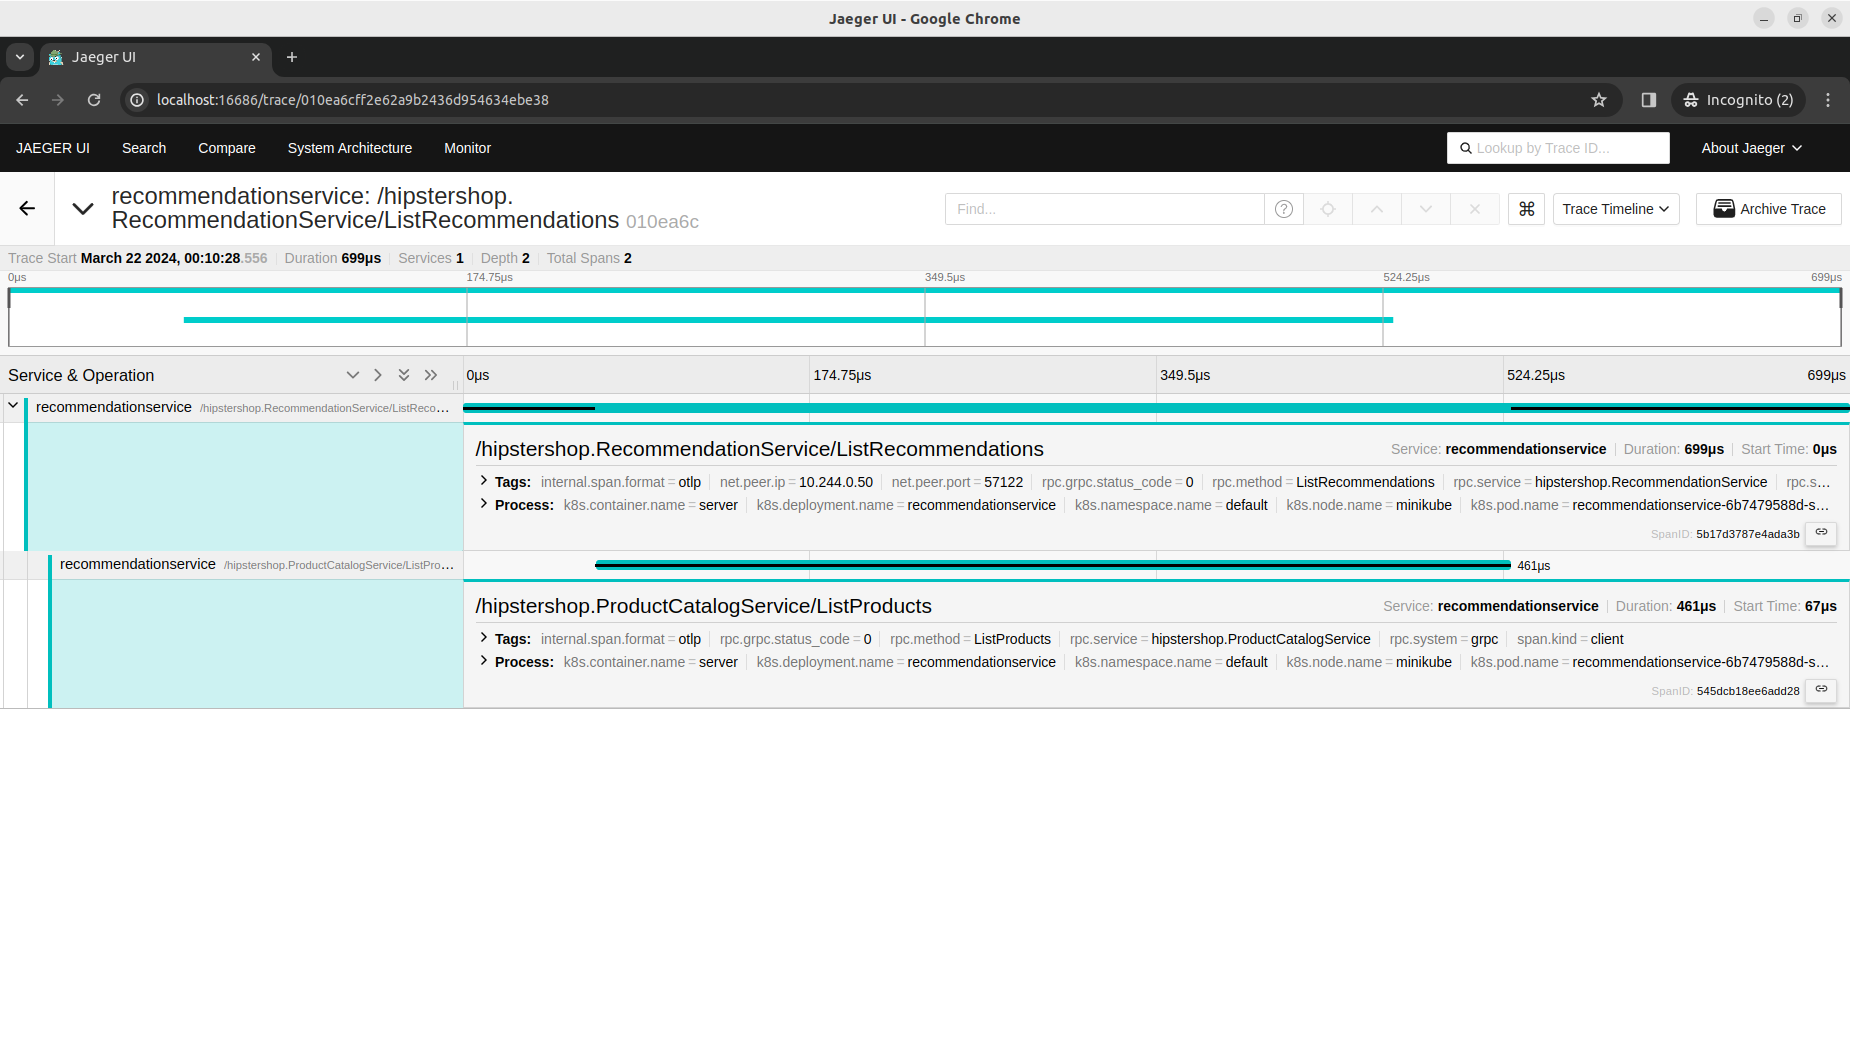
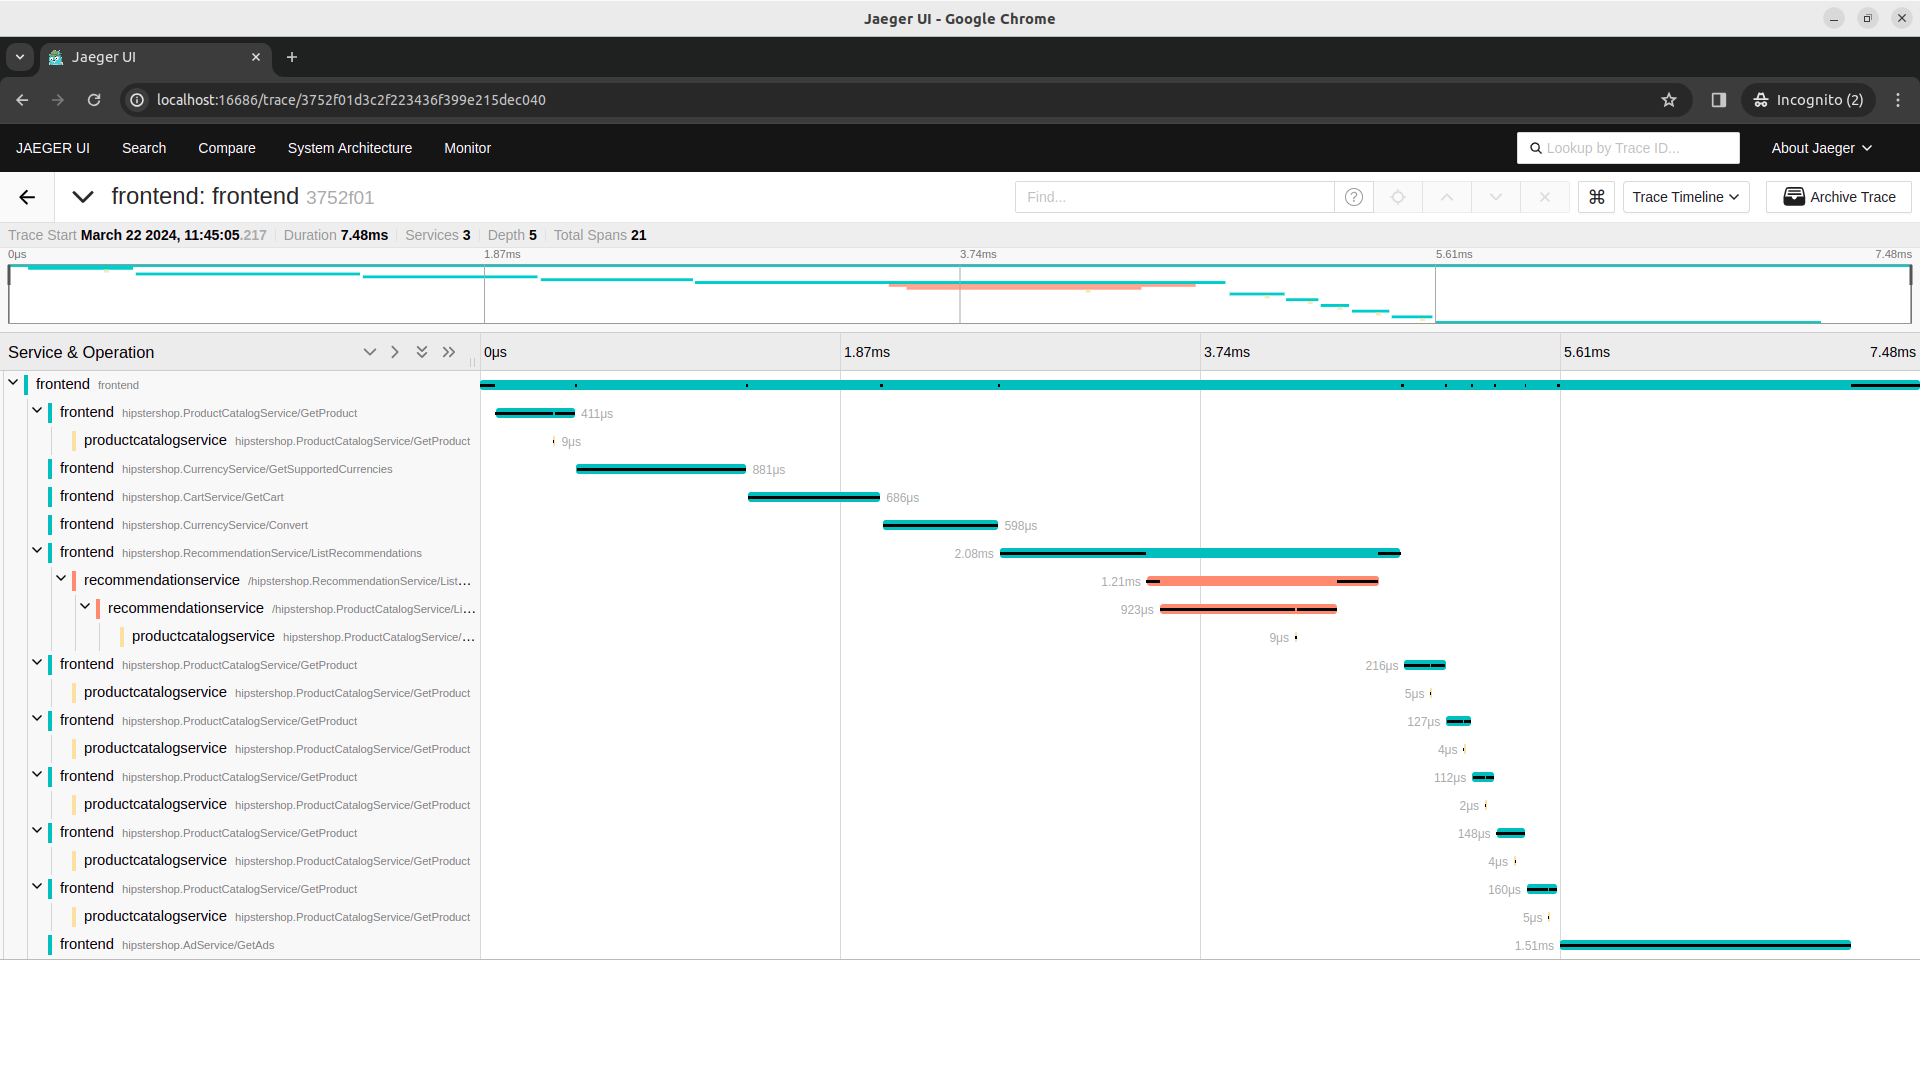
Similarly, in the Jaeger UI, both services now have traces collected that are ready for distributed analysis.
Library instrumentation
Previously, zero-code instrumentation for Python was done through environment variables and other language-specific mechanisms. This kind of automatic instrumentation is available for .NET, Java, JavaScript, PHP, and Python.
The same cannot be used with Go as it is a compiled language without language-specific mechanisms to inject code. Although there is an eBPF-based agent running inside a sidecar that OpenTelemetry Operator can use to auto-instrument also Go services. This approach requires elevated permissions and is currently in alpha but ready for evaluation.
Nevertheless, for Go services, it is possible to use instrumentation already built into Go libraries and frameworks. This approach requires some setup/configuration at the service initiation stage but, once implemented, allows you to reap the benefits of telemetry code emitted from the used libraries and frameworks.
We can see the configuration and setup of the otelgrpc ![]() package, which is the instrumentation library for grpc
package, which is the instrumentation library for grpc ![]() (implementation of gRPC is used in the Go checkoutservice from our Online Boutique sample application), in the main.go of that service where the configuration of context propagation strategy and set up of interceptors for the grpc library happen:
(implementation of gRPC is used in the Go checkoutservice from our Online Boutique sample application), in the main.go of that service where the configuration of context propagation strategy and set up of interceptors for the grpc library happen:
   // Propagate trace context always
   otel.SetTextMapPropagator(
       propagation.NewCompositeTextMapPropagator(
           propagation.TraceContext{}, propagation.Baggage{}))
   srv = grpc.NewServer(
       grpc.UnaryInterceptor(otelgrpc.UnaryServerInterceptor()),
       grpc.StreamInterceptor(otelgrpc.StreamServerInterceptor()),
   )
Together with tracing initialization:
func initTracing() {
   var (
       collectorAddr string
       collectorConn *grpc.ClientConn
   )


   ctx := context.Background()
   ctx, cancel := context.WithTimeout(ctx, time.Second*3)
   defer cancel()


   mustMapEnv(&collectorAddr, "COLLECTOR_SERVICE_ADDR")
   mustConnGRPC(ctx, &collectorConn, collectorAddr)


   exporter, err := otlptracegrpc.New(
       ctx,
       otlptracegrpc.WithGRPCConn(collectorConn))
   if err != nil {
       log.Warnf("warn: Failed to create trace exporter: %v", err)
   }
   tp := sdktrace.NewTracerProvider(
       sdktrace.WithBatcher(exporter),
       sdktrace.WithSampler(sdktrace.AlwaysSample()))
   otel.SetTracerProvider(tp)


}
In our sample application setting, specific environment variables are required to enable tracing of Go services.
$ kubectl set env deployment frontend ENABLE_TRACING="1" COLLECTOR_SERVICE_ADDR="demo-otel-collector:4317"
$ kubectl set env deployment checkoutservice ENABLE_TRACING="1" COLLECTOR_SERVICE_ADDR="demo-otel-collector:4317"
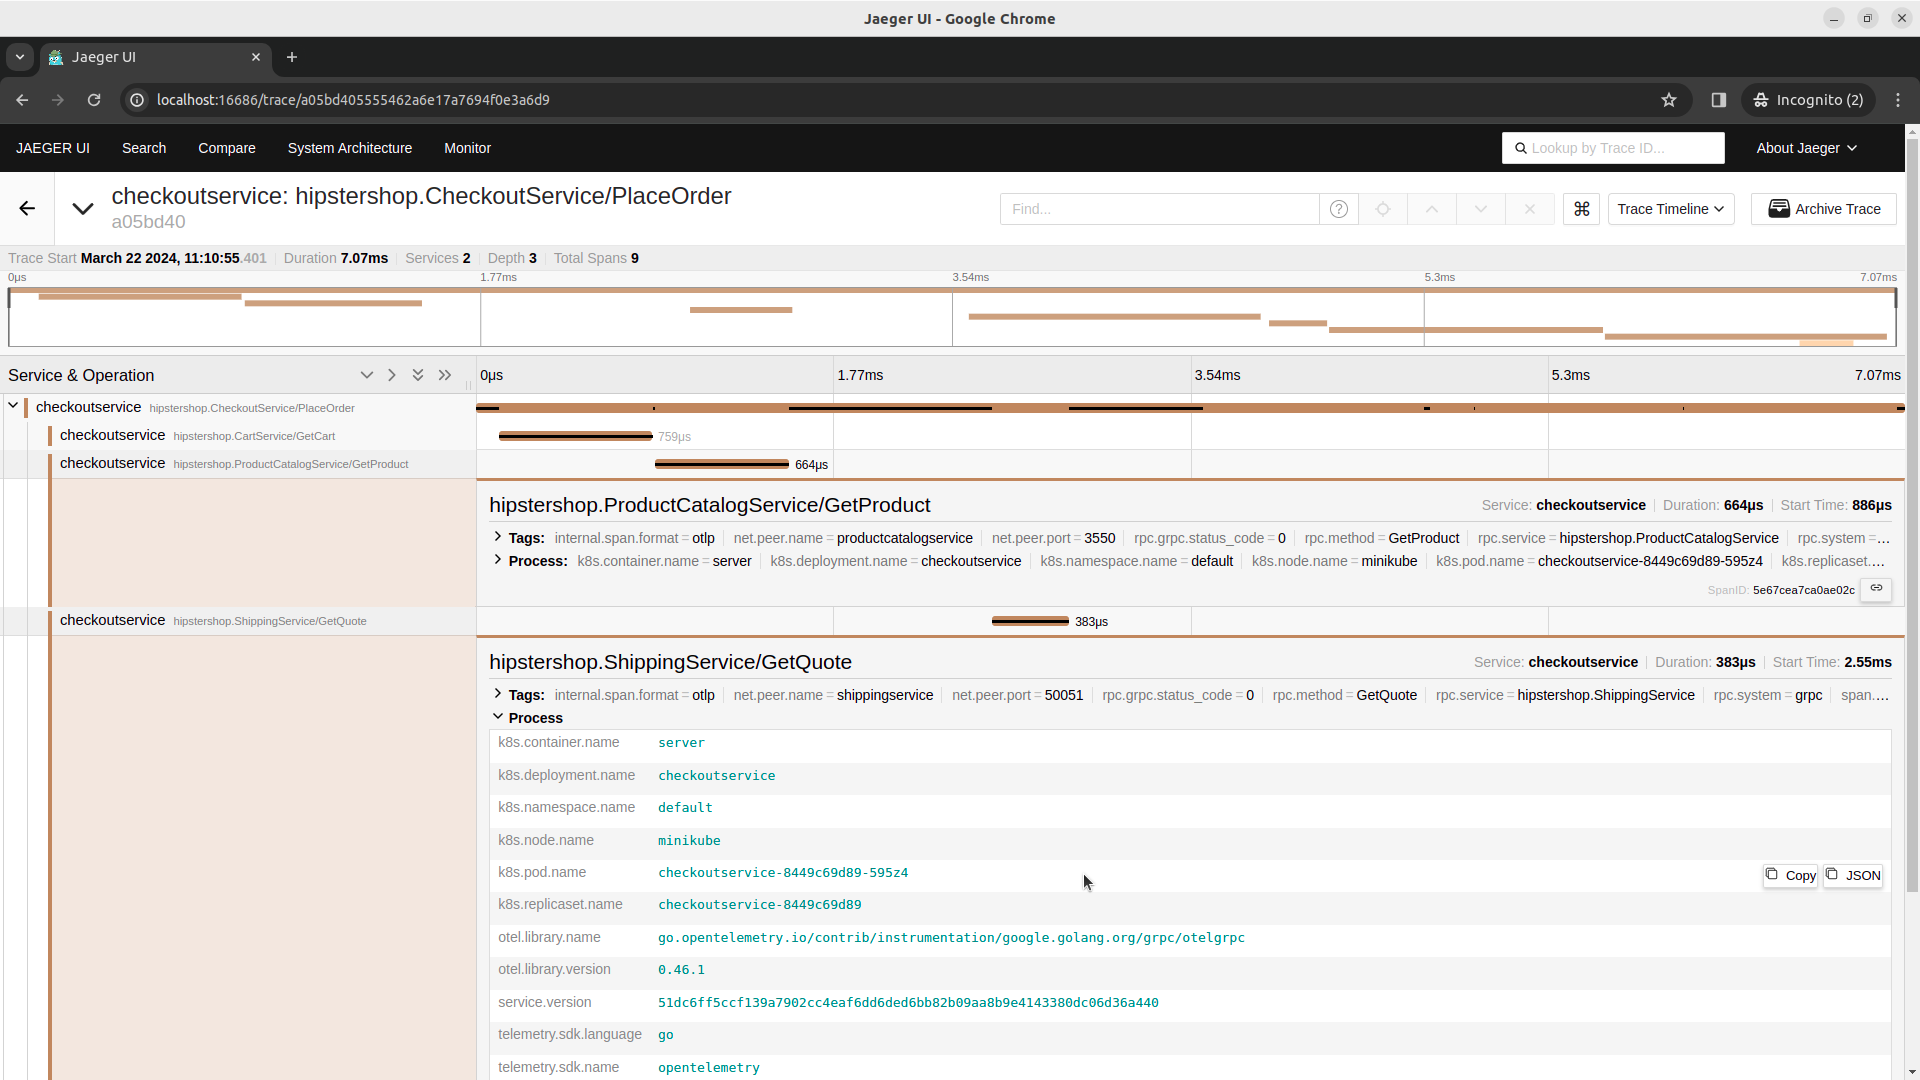
And finally, we can analyze traces from frontendservice or checkoutservice.
Code-based instrumentation
Manual instrumentation requires setting up OpenTelemetry API and SDK to the instrumented service code, similar to using library instrumentation. Then, using a TracerProvider, you can get a tracer in order to add traces and metrics events to the codebase.
We can create a simple span for tracing the execution time of a request done by checkoutservice to currencyservice (which is written in Node.js, and so far, tracing is not enabled for it). The required configuration for manual instrumentation is already in the checkoutservice. We can now add a span to the convertCurrency function.
func (cs *checkoutService) convertCurrency(ctx context.Context, from *pb.Money, toCurrency string) (*pb.Money, error) {
   tracer := otel.GetTracerProvider().Tracer("CurrencyServiceClient/Convert")
   ctx, span := tracer.Start(ctx, "convertCurrency")
   defer span.End()


   result, err := pb.NewCurrencyServiceClient(cs.currencySvcConn).Convert(context.TODO(), &pb.CurrencyConversionRequest{
       From:   from,
       ToCode: toCurrency})
   if err != nil {
       return nil, fmt.Errorf("failed to convert currency: %+v", err)
   }
   return result, err
}
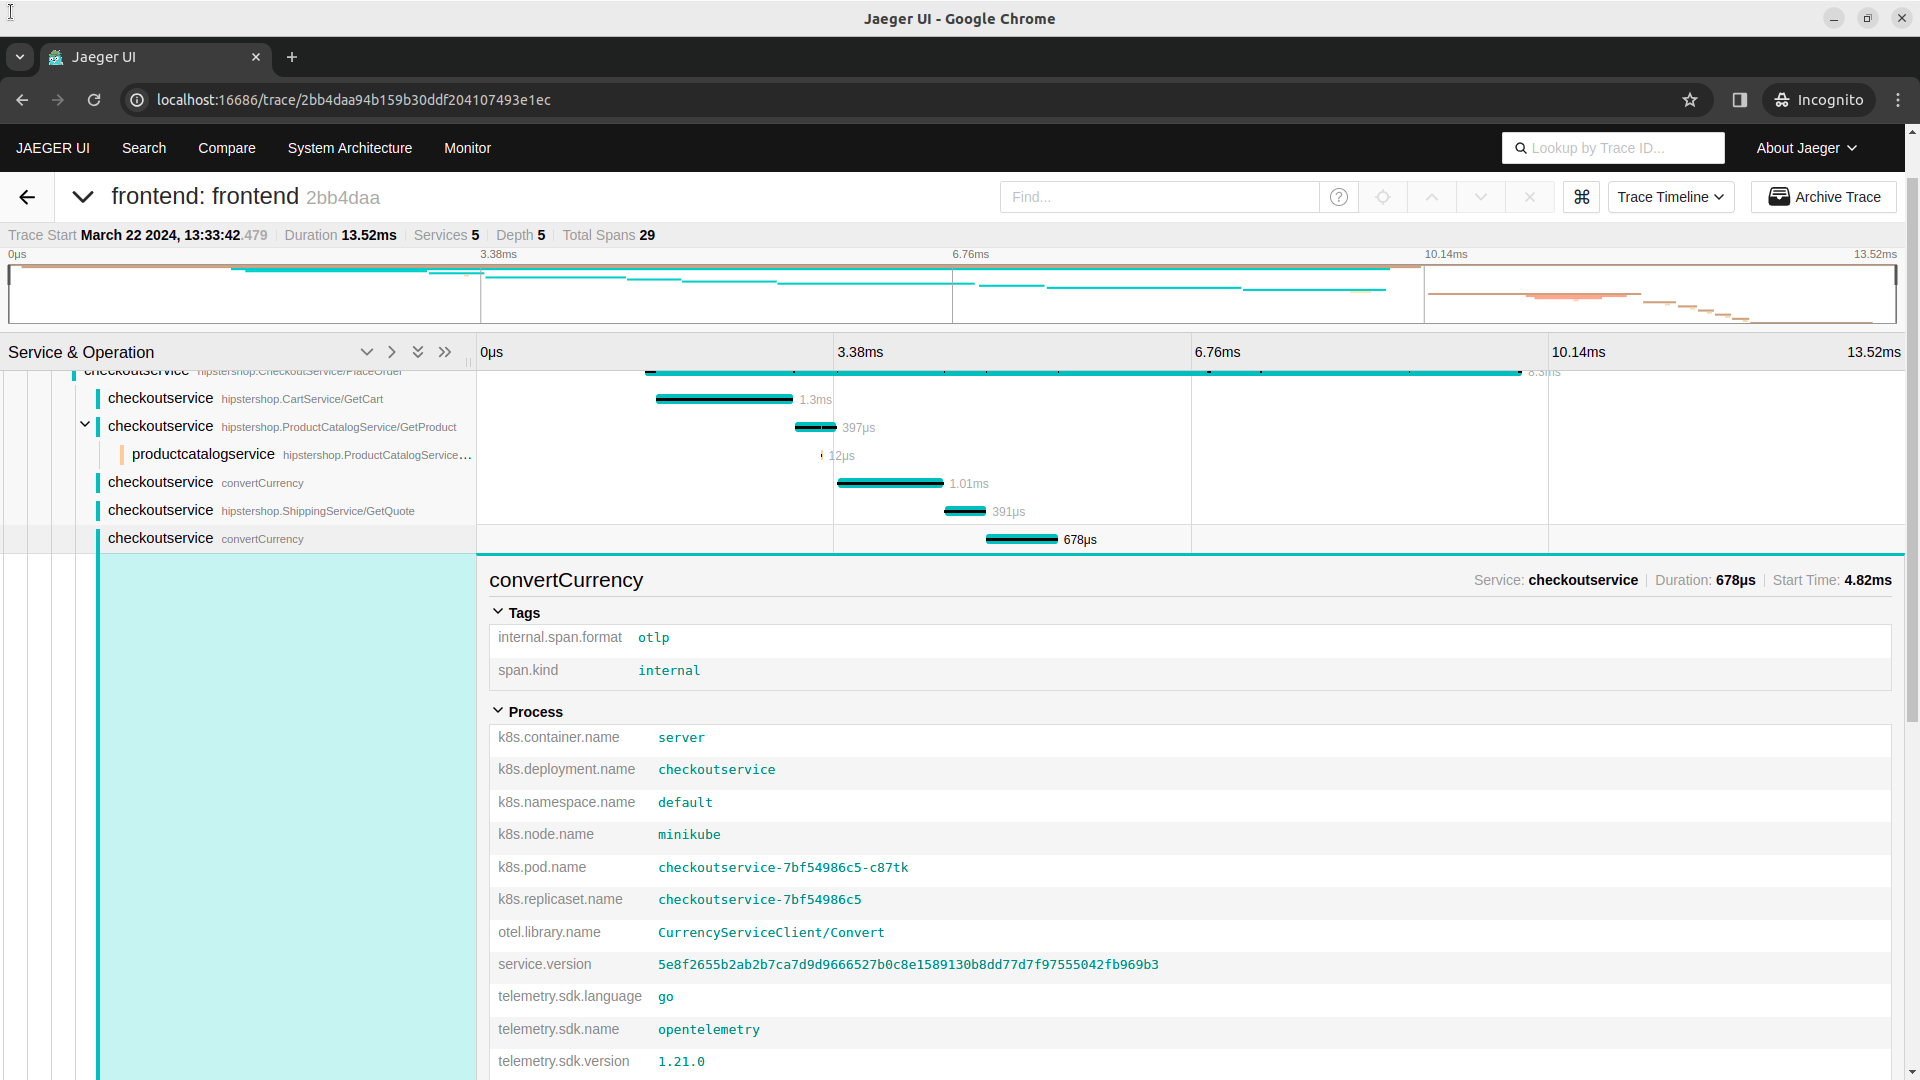
Once the checkoutservice is re-deployed we can find our manual trace in the Jaeger UI.
Conclusion
In this blog post, we've discussed the intertwined concepts of instrumentation, observability, and monitoring within computing systems, essential for managing the operational complexities of modern cloud-native applications. Through the lens of OpenTelemetry, we've explored how instrumentation lays the groundwork by providing raw data, enabling observability to comprehend system dynamics, and monitoring to synthesize this data for actionable insights.
It's crucial to recognize that selecting the most suitable approach tailored to your specific requirements is paramount. While manual and automatic instrumentation methods offer distinct advantages, a harmonious blend of these approaches often yields the most comprehensive results.
As you embark on new projects, it's imperative to contemplate the intricacies of observability and monitoring early in the development process. With the advent of OpenTelemetry, this task has become more streamlined and standardized, empowering developers to integrate observability seamlessly into their applications from inception.
To learn more about the realm of observability and monitoring with OpenTelemetry, we encourage you to explore the further documentation available. Start your next project with observability and monitoring at the forefront, ensuring heightened system visibility and enhanced operational efficiency. Embrace the power of OpenTelemetry to unlock insights that drive innovation and excellence in your endeavors.
Moreover, if you want to learn more about monitoring and observability services, we encourage you to check our offer.


