


With the rise of cloud computing it became easier to create complicated distributed systems based on microservices. With this came the need to monitor the statuses of the deployed services and many tools and technologies were created to do that. Observability became a standard element of the project lifecycle.
Unfortunately, users were limited to the framework they chose and had to adjust everything just to match the data format imposed by it. Two projects were created as an answer to the need for standardization - OpenTracing and OpenCensus. Both of those projects aimed to provide a vendor-agnostic way of handling traces regardless of the backend and framework used. The similarities between those projects allowed them to be merged into OpenTelemetry, a project managed by the Cloud Native Computing Foundation that became the industry standard for handling telemetry.
Collecting telemetry can be used to passively monitor applications and create dashboards and alerts. But what if instead of requiring an engineer to notice alerts or disruptions and manually react to them, you can create a set of automatic reactions to certain application behaviors? This is especially useful for applications that deal with network traffic. Online stores or cloud SaaS products can experience sudden and difficult to handle spikes of traffic related to a marketing campaign or a viral event. Just by extracting latency from a request and transforming it into a metric, you can add a script that automatically scales up the deployment should the latency reach a specified threshold.
This kind of OpenTelemetry use case was an inspiration for an open-source project called Aperture that CodiLime helped to create. In short, Aperture is a system that manages network traffic to prevent failures and optimizes resource utilization. In this article, we will go through elements of OpenTelemetry as well as what Aperture is and how this solution uses OpenTelemetry.
What is OpenTelemetry?
OpenTelemetry (OTel for short) is an open-source project that provides a set of APIs, libraries, agents and instrumentation to enable observability in software applications. It allows developers to collect telemetry data, such as traces and metrics, from their applications to gain insights into their performance and behavior.
The OpenTelemetry Collector offers a vendor-agnostic implementation of how to receive, process and export telemetry data. It removes the need to run, operate, and maintain multiple agents/collectors. This works with improved scalability and supports open-source observability data formats (e.g. Jaeger, Prometheus, Fluent Bit, etc.) sending to one or more open-source or commercial backends. The local Collector agent is the default location to which instrumentation libraries export their telemetry data. (source ![]() )
)
OTel Collector can be deployed in three different ways - either by omitting the Collector instance entirely and sending telemetry signals directly to a backend consumer endpoint via SDK, running Collector as a sidecar/daemonset near the source application, or by deploying as a separate instance with possibly multiple different Collectors.
There are multiple telemetry signals a user can send via OpenTelemetry. Processed signals can then be sent to multiple exporters, which are maintained by the community, and this list is constantly expanding.
Here, you can find more information about our environment services where we described how can we support you in terms of monitoring and observability.
Logs
First, there are logs which represent the recording of an event. They contain a timestamp, the body of the event, severity values, and additional fields like TraceId or SpanId to map those log events to parent traces. The log data model in OTel was designed to handle logs from different sources - system, application logs, or machine events. It’s a representation of common attributes that are usually processed by logging systems. There is also an additional field called resource that describes the source of the signal, an entity for which telemetry is recorded. By using batch processing, a resource field can be recorded only once for multiple logs.
Traces and spans
Traces are lists made of spans that describe a path a request takes in the application, and spans describe a single unit of operation, for example, a function in the code. They contain information about the length of the performed operations, and additional attributes to indicate the type of span or a returned status. Using traces can help users identify bottlenecks and apply optimization techniques when requests take too long to process.
Baggage
Sometimes, there is metadata about a request/span that is available further in the processing stack. To make use of this data, users can add baggage to the signal. This kind of metadata is then propagated further and can be processed and removed at any moment. Baggage is a separate type of data from attributes, so its value has to be explicitly saved there.
Metrics
Metrics are signals that describe service measurements captured in time. Metrics consists of measurement value, timestamp and other metadata identifying the source of the event. The most commonly used metrics are Counter - a value that accumulates over time, Histogram - representing a distribution of values, and Gauge - a representation of a value in point in time.
What is Aperture?
Aperture is an open-source load management platform designed for classifying, rate limiting, queuing and prioritizing API traffic in cloud applications. Built upon a foundation of observability and a global control plane, it offers a comprehensive suite of load management capabilities. These capabilities enhance the reliability and performance of cloud applications while also optimizing resource utilization. (source ![]() )
)
The core components of the Aperture architecture are the controller and agents. The Controller’s control loop bases its decision to reject or accept traffic scale up or down on the metrics collected using OpenTelemetry Collector from many different agents.
Aperture defines the metrics collection rules in an agent’s configuration but also in a custom policy language. Components of the policy can include:
- Classifiers – to organize requests and flows into categories,
- Flux Meters – to collect latency from selected requests,
- Infra Meters – to add custom metrics processing pipelines.
>> Looking for further information about Aperture? Check it out at Product Hunt ![]() .
.
How does Aperture use OpenTelemetry?
OpenTelemetry configuration is located at both the agent and controller level in Aperture. It consists of lists of extensions, processors, receivers, and exporters.
// Config represents OTel Collector configuration.
type Config struct {
    Extensions map[string]interface{} 'json:"extensions,omitempty"'
    Receivers  map[string]interface{} 'json:"receivers,omitempty"'
    Processors map[string]interface{} 'json:"processors,omitempty"'
    Exporters  map[string]interface{} 'json:"exporters,omitempty"'
    Connectors map[string]interface{} 'json:"connectors,omitempty"'
    Service    *Service               'json:"service"'
}
Request-related metrics, by default, can be collected from three different sources depending on the kind of integration that is installed. It can be either sent from SDK integration in the form of spans, from the Envoy filter added to the Istio service mesh, or from a plugin to a gateway written in Lua. By using InfraMeters, a user can also provide custom metrics to scrape – either from the application endpoint or the system’s default metrics, such as Kubelet.
All of the spans and traces are transformed into OTel logs and processed in the same way. Those logs are the source for the internal metrics used by the policy control loop. Some of the attribute values are needed to feed the decision system, and some are sent to cloud SaaS products for use in advanced dashboards. So, the system creates metrics for its own use.
Some of the metrics are subject to cardinality explosions and that’s why the rollup processor is applied to them. For example, for network requests, there can be a lot of different values for processing time or size of request, but they can have common attributes like user ID or IP address. To reduce the cardinality of those values, the rollup processor calculates averages and other statistical data grouped by a set of attributes identifying a flow. But with huge levels of traffic, even rollups are not enough. In this situation, Aperture explicitly puts the „REDACTED_VIA_CARDINALITY_LIMIT” value so we don’t flood the metrics collection system.
There are also batching processors configured before and after rollup processors. To save resources, we don’t want to process logs one by one. Before the rollup is calculated for the group of requests, batching is preparing the said group. Also, the amount of logs is reduced after rollup, from a thousand logs to three, for example, and we also don’t want to take them out bit by bit. After rollup is done, we should group outgoing requests to be sent to Prometheus. This kind of configuration reduces the burden on external services that consume metrics.
To run seamlessly within Aperture, the Open Telemetry Collector had to be forked and modified. By default, the Collector is running its own GRPC server for receiving data. After forking, it was integrated with an internal Aperture server, which allows for multiple GRPC services to run on the same port. It allowed the configuration of a common logger and usage of the Uber FX framework. This framework is used to provide manageable dependency injection and to run pieces of code in separate FX applications. By using it, we can dynamically swap and arrange parts of the pipeline depending on the dynamic configuration.
Processing OpenTelemetry logs can give us an opportunity to configure alerts. We can set alerts depending on the value itself or the number of attributes or lack thereof.
Checking pipelines created in OpenTelemetry
There is an extension for OpenTelemetry that can help view what kind of pipelines are configured, called Zpages ![]() . On port 55679, you can see your pipelines and also enabled features and extensions.
. On port 55679, you can see your pipelines and also enabled features and extensions.
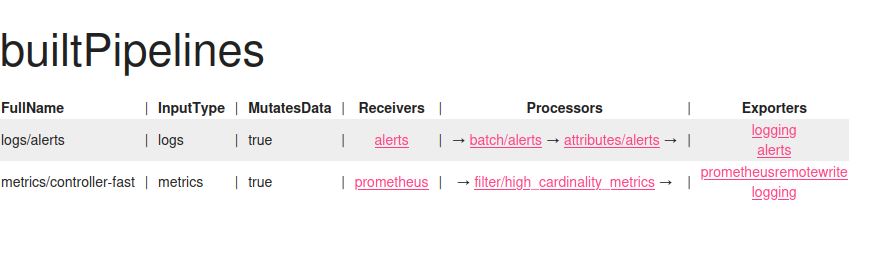
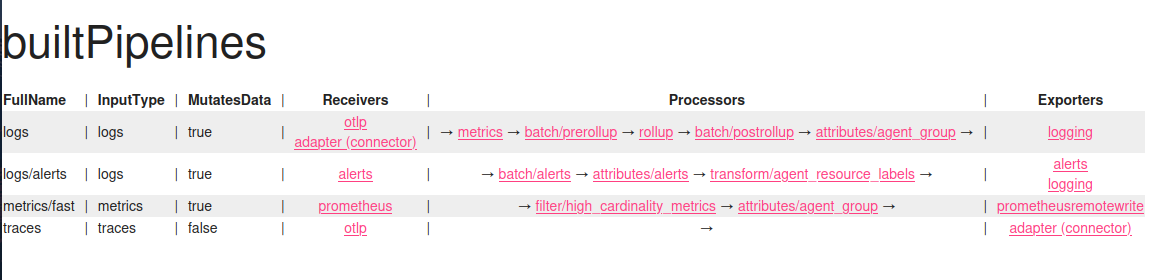
Here is how pipelines look for the Aperture controller and agent:
The first image describes controller pipelines - only alerts and high cardinality metrics are processed and written to Prometheus. For the second image, agent pipelines, there is also additional processing that adds agent-specific attributes to the telemetry, for example, agent group (a value that describes general agent context - it may be a namespace in K8s or another name for VM deployments).
Conclusion
OTel Collector enables users to process different telemetry signals, enrich them with data, group them according to common attributes, or rollup data that is too granular to reduce cardinality. Aperture collects data from SDKs and gateways in different formats, and with the help of OTel Collector, it can be processed the same way. After forking the OTel Collector repository, Aperture switched its internal server to run on the same port as Aperture's main server. The Collector server is then integrated into the codebase smoothly and can be used internally without network overhead while also being exposed on an external port for telemetry receivers. Because both projects are open source, customization for specific use cases is possible and can produce great results.


