Effective debugging and monitoring are crucial for performance optimization and troubleshooting in Linux systems. This guide dives into an array of essential tools that will improve your observation and debugging capabilities.
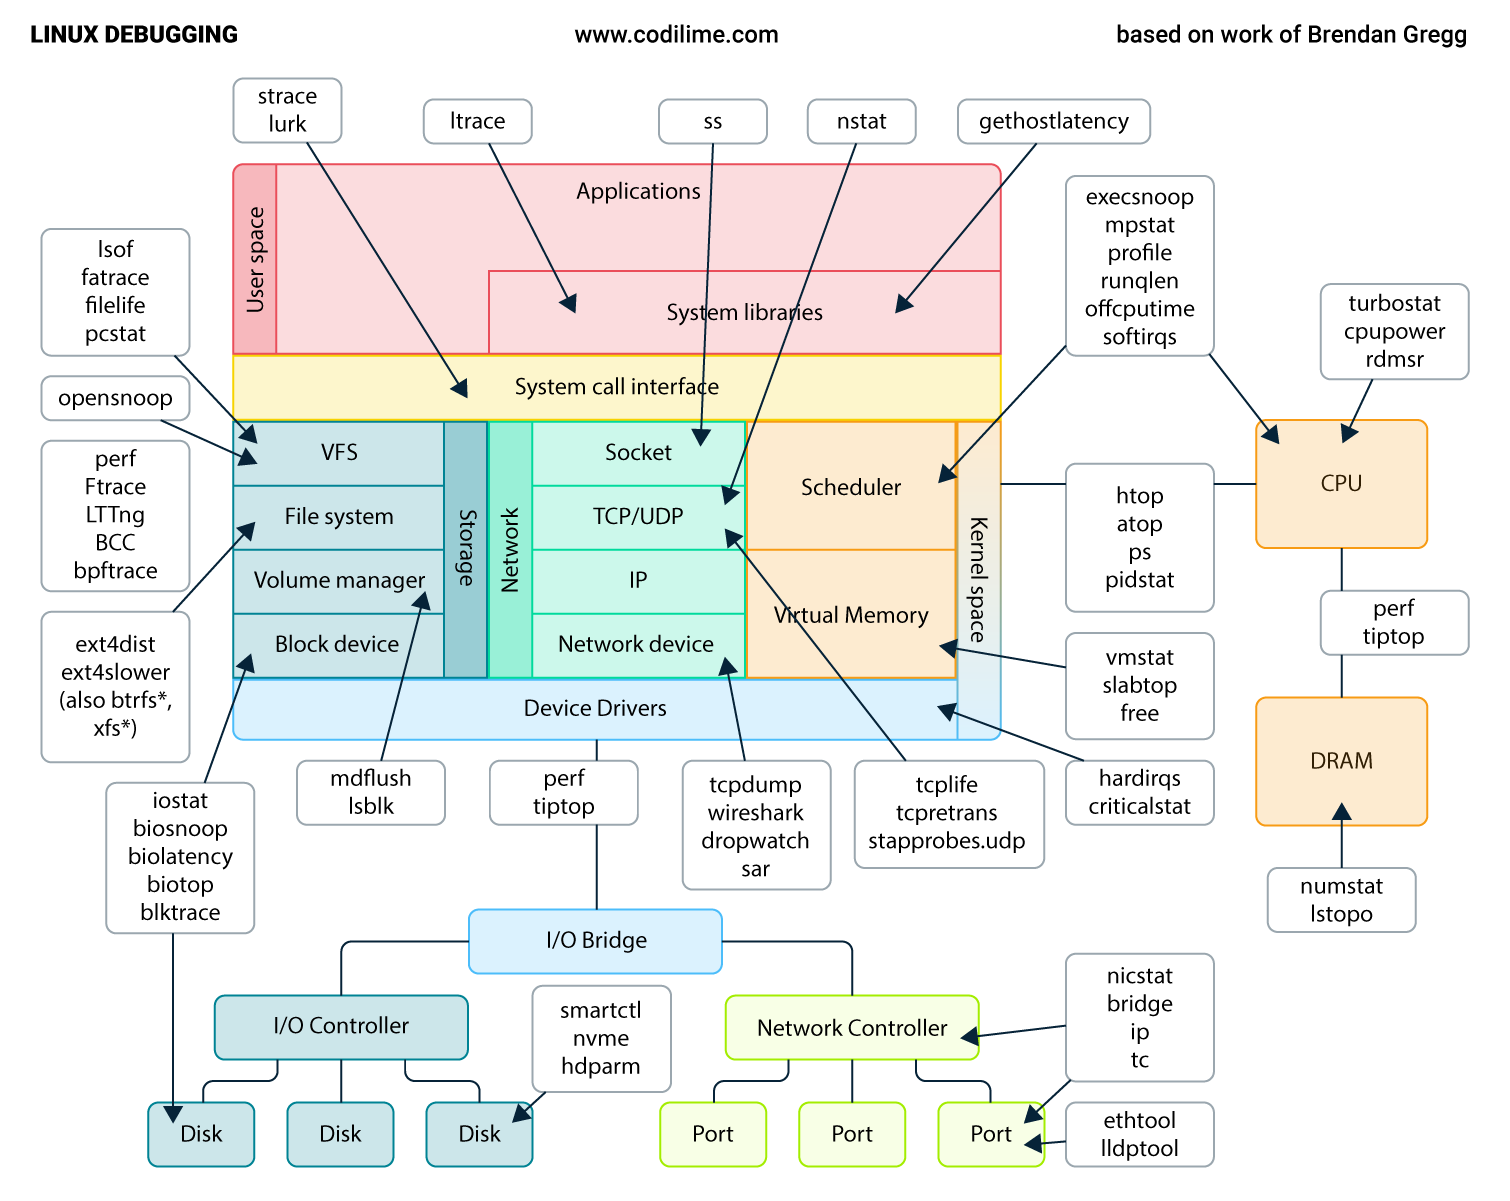
Originally this article was inspired by a copy of the work of Brendan Gregg that I found on Mastodon some time ago. The social post had “only” a simple picture with a lot of arrows and utility names but the value of such a picture was overwhelming.
Here in this blog post we will present an updated picture (we added a few programs that we’ve found useful). Since many of the applications below might be unknown to readers we have added a few words of description for each one of them. Whether you're a seasoned DevOps or system administrator or just starting out, this guide will equip you with the tools to better understand and optimize your Linux environment.
The diagram overview
So without further ado let's start with the diagram itself:

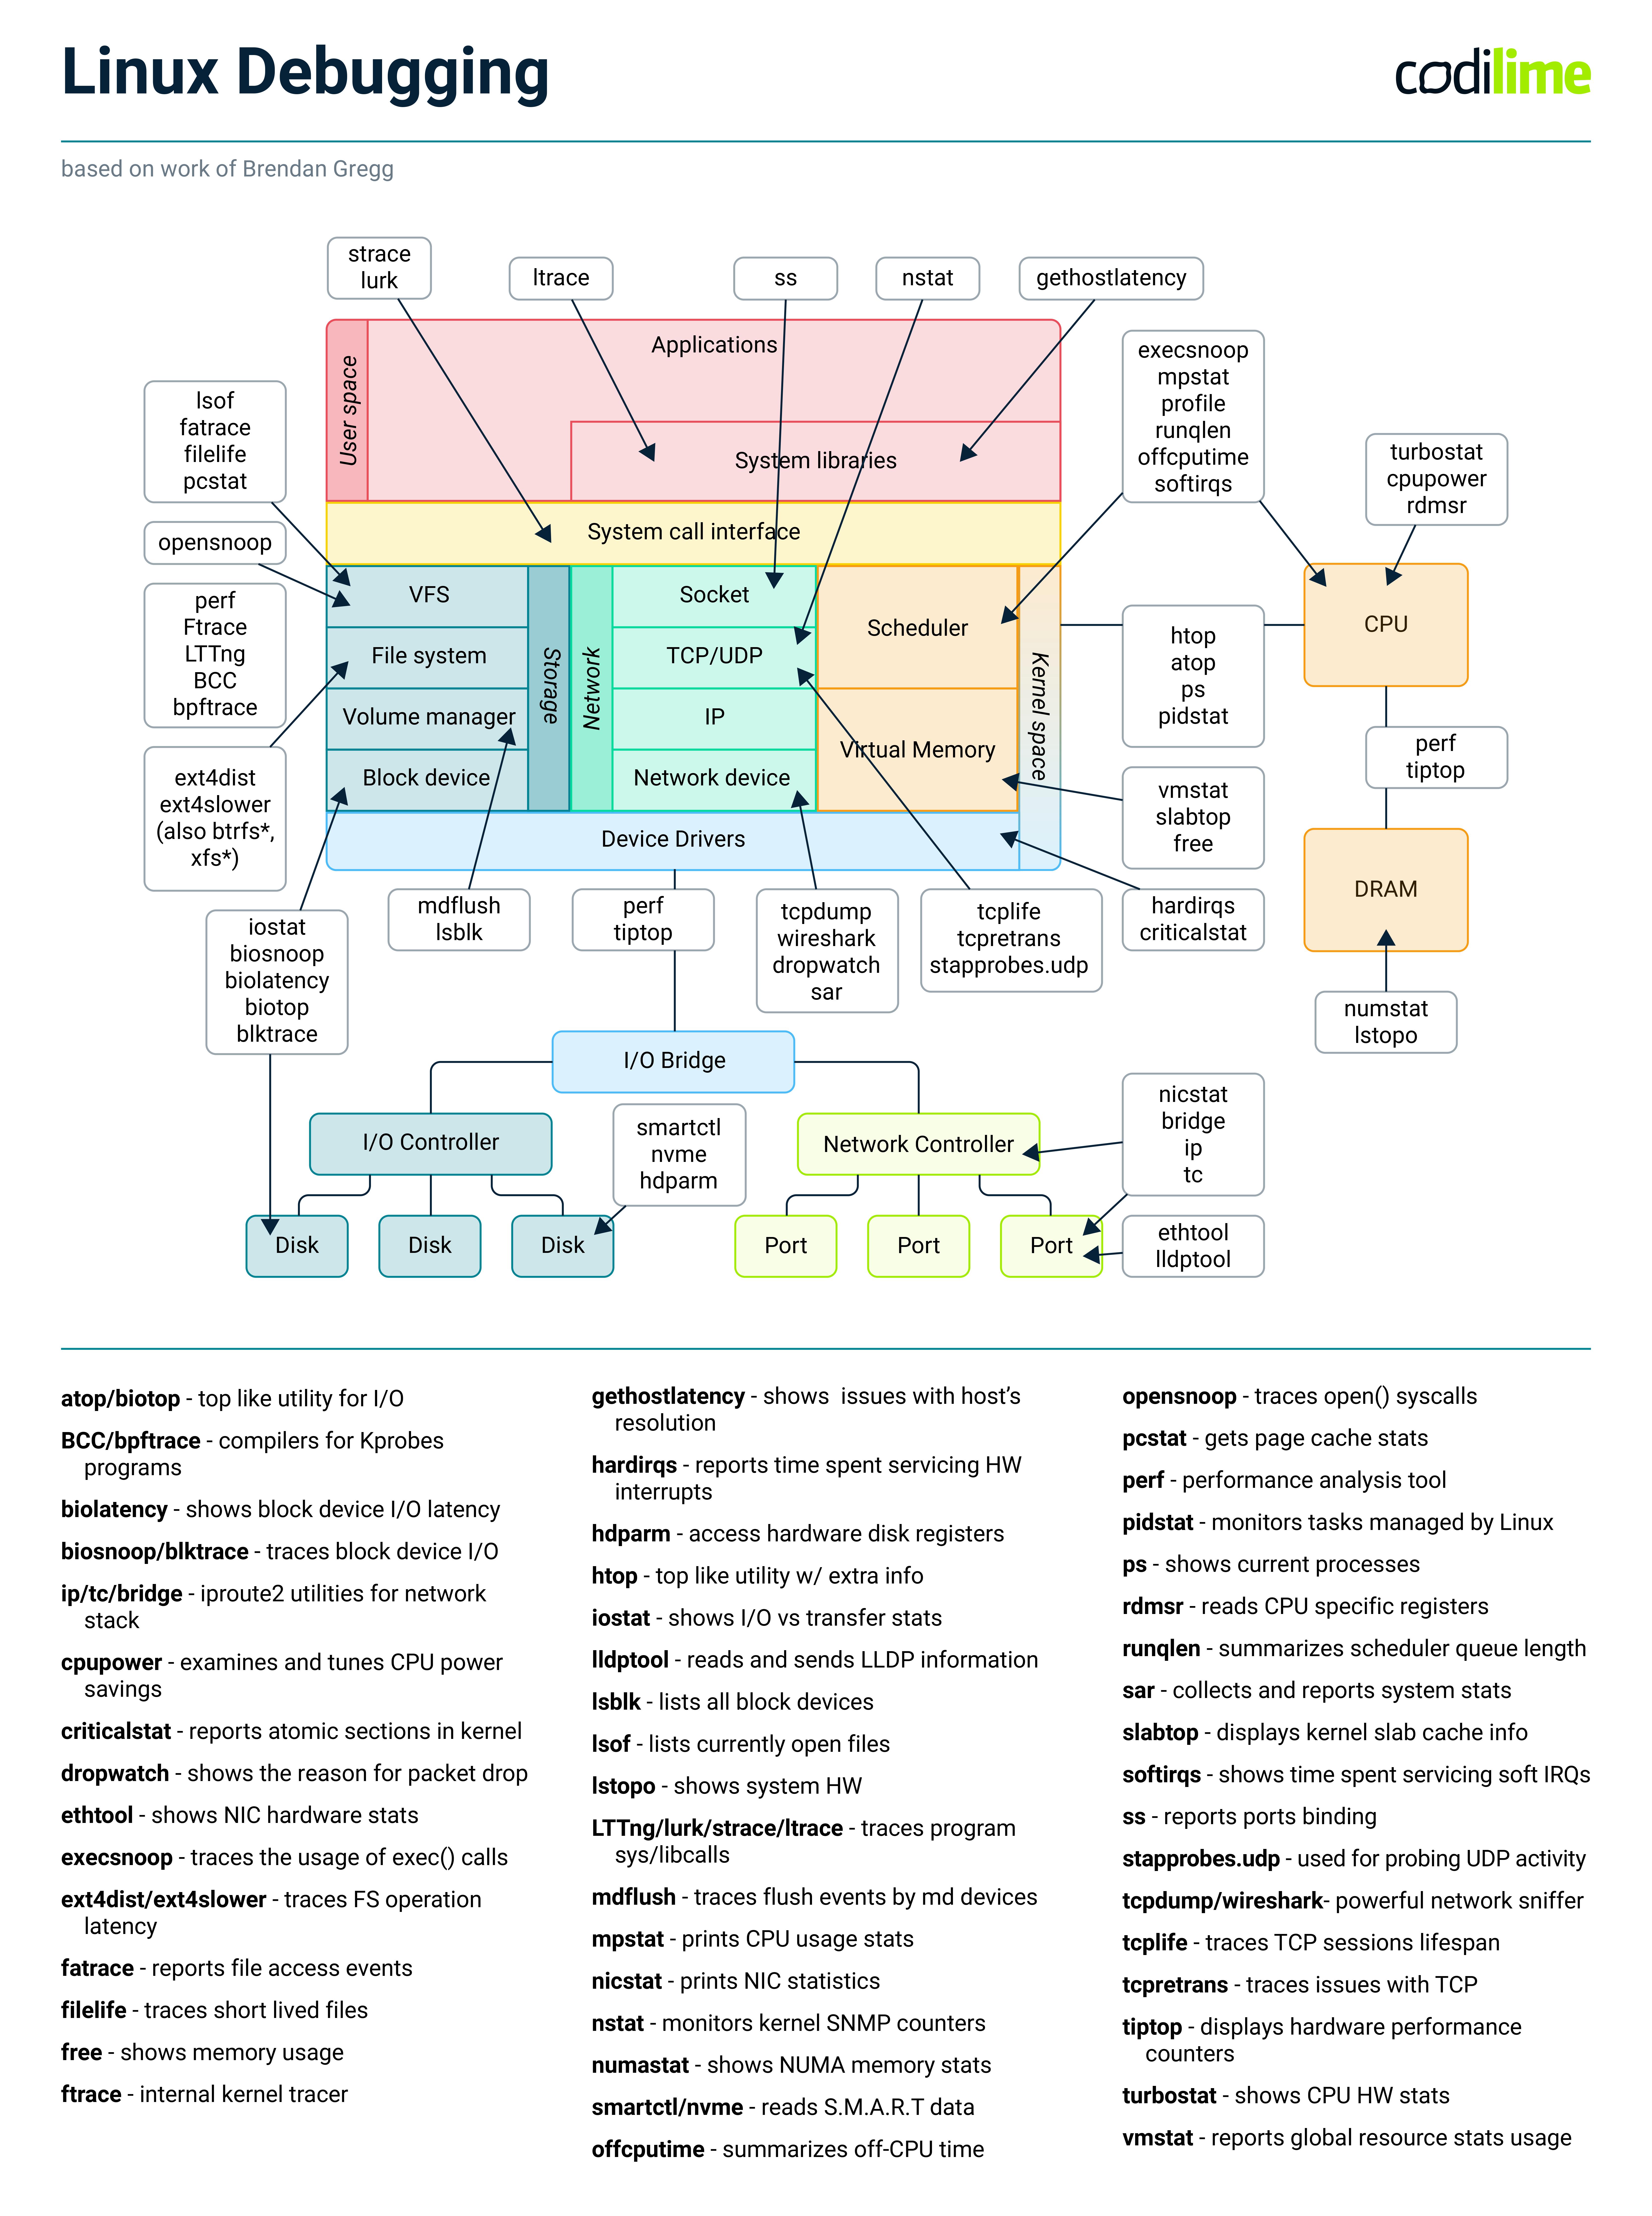
Note: The following blogpost is also available as a single-page cheat sheet for your convenience. You can find the file for download at the end of the article.
Linux observability and debugging tools list
As for the programs here is the list of them in alphabetical order:
atop - is a top-like utility but concentrating more on system resources such as I/O, network, cpu.
BCC - is an eBPF compiler for programs that can be attached to kprobes (Kernel Probes enable dynamically breaking into any kernel routine to collect debugging and performance information non-disruptively). BCC allows programs to be written in C, Python or Lua. It includes several utilities as examples that will be mentioned later.
biolatency - summarizes block device I/O latency as a histogram. This tool is included with BCC.
biosnoop - traces block device I/O and print details, including issuing PID. This tool is included with BCC.
biotop - is a top-like utility for I/O usage. This tool is included with BCC.
blktrace - generates traces of the I/O traffic on block devices.
bpftrace - is a high-level programming language dedicated to enhancing tracing for Linux systems. Similar to BCC.
bridge - is part of iproute2 concentrating on L2 traffic in Linux that is passing through a bridge. Aside from listing bridges, it also can show FDB, MDB (unicast and multicast forwarding database) or VLAN/VXLAN data.
cpupower - is a collection of tools to examine and tune power saving settings (such as frequency or Intel Turbo Boost status).
criticalstat - reports long atomic critical sections in kernel with useful stacktraces showing their origins. This tool is included with BCC.
dropwatch - shows the reason why a packet was dropped allowing pinpoint debugging to NIC, firewall, routing or others.
ethtool - shows hardware counter configuration and other data (such as inserted SFP module) that can be extracted from NIC. Can also be used to configure NIC on a hardware level, such as hashing, queues and other knobs that can enhance performance.
execsnoop - traces the usage of exec() system calls. This utility is ideal for the monitoring of short-lived processes that would be easily missed in top/ps. This tool is included with BCC.
ext4dist - summarizes ext4 operation latency. This toolis included with BCC. Similar tools for XFS and BTRFS exist as well.
ext4slower - traces slow ext4 file operations, with per-event details. This tool is included with BCC. Similar tools for XFS and BTRFS exist as well.
fatrace - reports file access events (from all processes). Its main purpose is to help find the purpose of HDD not going to sleep.
filelife - with the help of eBPF, this utility helps trace short-lived files for performance purposes.
free - displays the amount of free and used memory in the system.
ftrace - is an internal tracer designed to help out developers and designers of systems to find out what is going on inside the kernel. It’s especially useful for analyzing latencies and performance issues affecting user space.
gethostlatency - is a utility designed to solve issues with host name resolution. It shows latency for getaddrinfo/gethostbyname calls. This tool is included with BCC.
hardirqs - summarizes the time spent servicing hard interrupts (IRQ created by physical hardware) and shows this time as either totals or histogram distributions. This tool is included with BCC.
hdparm - reads and writes hardware disk registers such as performance/power mode, encryption, and spinning status.
htop - provides similar information to top command but with much more detail, such as per CPU usage. Allows the user to quickly glance at what is happening on the system.
iostat - is used for monitoring system input/output device loading by observing the time the devices are active in relation to their average transfer rates.
ip - is part of iproute2, concentrating on several layers of OSI level, from interface/link statistics, through L3 routing up to L4 traffic policy.
lldptool - reads and interprets LLDP packets sent by the attached switch(es). Allows to easily identify which port Linux is connected to and advertises Linux’s presence to neighboring switch(es).
lsblk - list all block devices (physical and virtual) and their topology in the underlying system.
lsof - outputs a list of currently open files (hence the name). File can be a regular file, directory, socket, or the network connection/port on which the process is listening.
lstopo - shows system hardware configuration along with device NUMA assignment in a nice graphical output.
ltrace - is a similar program to strace but more concentrated on dynamic library calls which are called by the executed process and the signals which are received by that process. It can also intercept and print the system calls executed by the program.
LTTng - The Linux Trace Toolkit (LTTng in short) is an open-source software toolkit that one can use to trace the Linux kernel, user applications, and user libraries concurrently.
lurk - is similar to strace with some optimizations made for readability.
mdflush - traces flush events by md, the Linux multiple device driver (used for the software RAID). This tool is included with BCC.
mpstat - prints CPU usage statistics divided per CPU in SMP (symmetric multiprocessing) systems.
nicstat - prints out network statistics for all network cards including PPS, throughput, packet size, etc.
nstat - is a simple tool designed to monitor kernel SNMP counters and network interface stats.
numastat - show per-NUMA-node memory statistics for processes and the operating system.
nvme - is an NVM storage command line utility. Among other uses, it can read S.M.A.R.T events, NAND, PCIE statistics and send custom commands to underlying devices.
offcputime - summarizes off-CPU (where time is spent waiting while blocked on I/O, locks, timers, paging/swapping, etc.) time by kernel stack trace. This tool is included with BCC.
opensnoop - traces open() syscalls, showing the file name (pathname) and returned file descriptor number (or -1, for error).
pcstat - gets page cache statistics for files in order to provide an answer as to whether Linux is caching data or not.
perf - is a performance analysis tool in Linux. It’s a userspace controlling utility, accessed from the command line which provides a number of subcommands such as: stat, top, record, report, etc. It supports hardware performance counters, tracepoints, software performance counters, and dynamic probes.
pidstat - is used to monitor every individual task currently being managed by the Linux kernel on the Linux system. IT can monitor every task on the system, including the child’s task of any task, along with details such as CPU usage or disk I/O.
ps - shows information about current processes. Although not the most sophisticated tool, it's always available on Linux.
rdmsr - reads CPU model-specific registers (MSR). MSRs are control registers provided by the processor implementation so that system software can interact with a variety of features, including performance monitoring, checking processor status, etc.
runqlen - summarizes scheduler queue length as a histogram. It can be used to identify imbalances such as processes occupying a CPU causing queuing. This tool is included with BCC.
sar - collects, reports or saves system statistics. Aside from network statistics it can be used to monitor other devices, such as disks as well.
slabtop - displays kernel slab cache information in real time. A slab is a set of one or more contiguous pages of memory while a slab cache is a “container” of multiple slabs of the same type.
smartctl - reads S.M.A.R.T data from the underlying disk device. Data includes sector remapping, errors, rereads, logs and other statistics reflecting the health and performance of storage devices. Older versions of smartctl were unable to access NVM devices. In such cases, the nvme utility should be used.
softirqs - summarizes the time spent servicing soft IRQs (soft interrupts), and can show this time as either totals or histogram distributions. This tool is included with BCC.
ss - is the tool that replaced the depreciated netstat utility. Allows viewing of port binding on the running system along with process names, connection statutes. The CLI is almost identical to its predecessor.
stapprobes.udp - is a part of the SystemTap (stap for short) utility used for gathering information about the running Linux system. Among other things, it provides probe points for UDP activity.
strace - runs the specified command until it exits. It intercepts and records the system calls which are called by a process and the signals which are received by a process.
tc - is part of iproute2 concentrating traffic control settings. Aside from displaying QoS counters it can also deal with traffic offloading (tc flower).
tcpdump - is a network sniffer that can display traffic activity happening on selected (or all) interfaces. Due to CLI’s nature, it provides invaluable information on traffic that is happening on systems where a graphical environment is not an option..
tcplife - traces TCP sessions in systems and summarizes their lifespan. This tool is included with BCC.
tcpretrans - shows possible issues with TCP connections by displaying retransmits and other details.
tiptop - displays hardware performance counters for Linux tasks. It's similar to the top utility but enriched by hardware counters.
turbostat - shows CPU topology, temperature, frequency and idle statistics.
vmstat - reports information about processes, memory, paging, block I/O, traps, disks and cpu activity in defined intervals.
wireshark - is a graphical tool complementing tcpdump in many ways. Due to the several subtools included, as well as a vast number of supported protocols, it makes network debugging easier than tcpdump.
Summary
While the picture and list are far from being comprehensive, this is a good place to start. If you think that there are tools missing, please contact us and we will update this blog post.
Linux observability and debugging tools cheat sheet to download
For those who prefer a printable version, we have provided the cheat sheet in PDF format here.


