


The data in network monitoring products is crucial to catching your users' attention. However, are you sure that the way you present this data across your product truly meets your users' needs?
We always get biased based on our experience, and there’s nothing wrong with it. Different people use different software and get different experiences. But how to make sure that your experience and the way of doing your work are viable for your users?
In this blog post, I’d like to explain to you how to handle the vast data that networking applications tend to provide. To explain this, as examples, I’ll present our methods during the usual cooperation with our clients.
We have divided our optimized data monitoring process through the UI into several simple steps.
- Defining the type of data and organizing it.
- Grouping data into categories customized for your users.
- Implementing appropriate data visualization techniques.
- Continuously taking actions based on user needs.
Define and organize your data
We handle various data types inside monitoring applications, including device-related information such as manufacturer or serial number, service-related details like state or license expiration date, and more. Do you monitor your CI/CD pipelines? That’s also a different group of data. Automatic tests? Same! Simple logs? You guessed it right. The possibilities are endless, so let's precisely define our requirements.
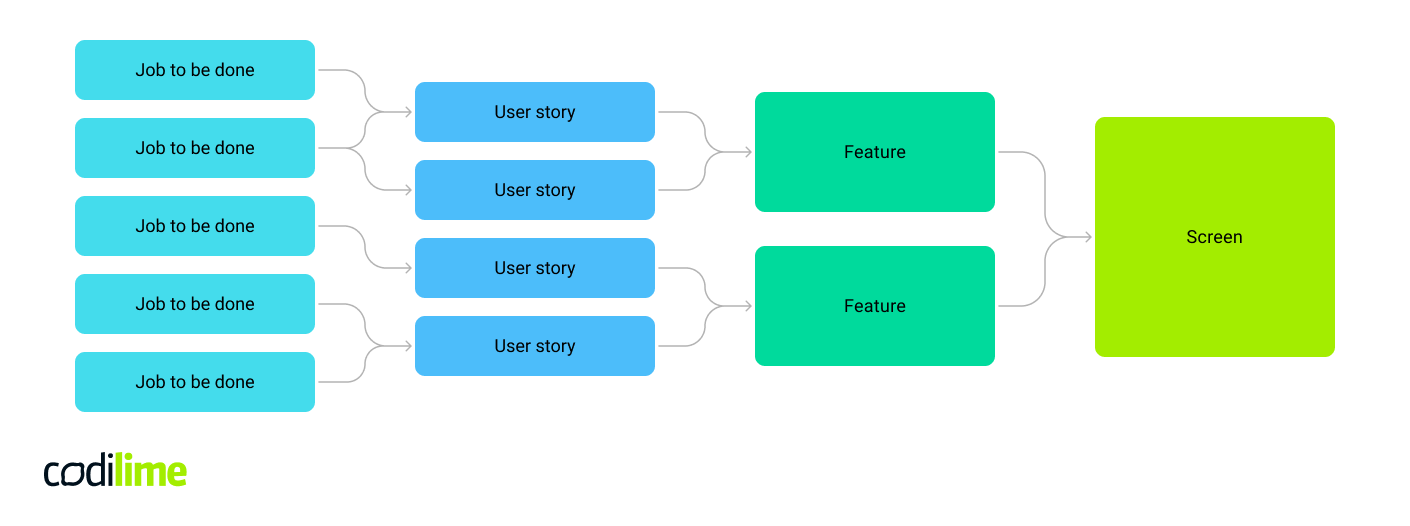
First of all, you have to define the range of data on particular screens. The best way to do this is to design a visual information architecture that clearly shows all the connections and dependencies between each screen of your product. After it is drawn, let’s assign all the data endpoints to particular screens. When the mapping is done, we can see what data endpoint goes where, what they have in common, and how your vision is revealed.
Great, but it has to include your users?
As I mentioned above, different users have different experiences, even across one company. A manager will look for different kinds of data than an engineer. Define your user groups (personas ![]() ) and try to align only the crucial data to particular screens per role.
) and try to align only the crucial data to particular screens per role.
The most important thing is to engage your users as soon as possible. You need their voice since your opinion is strongly biased at this point. Letting in someone from “the outside” of the process may only shed more light on the subject.
Classify gathered data
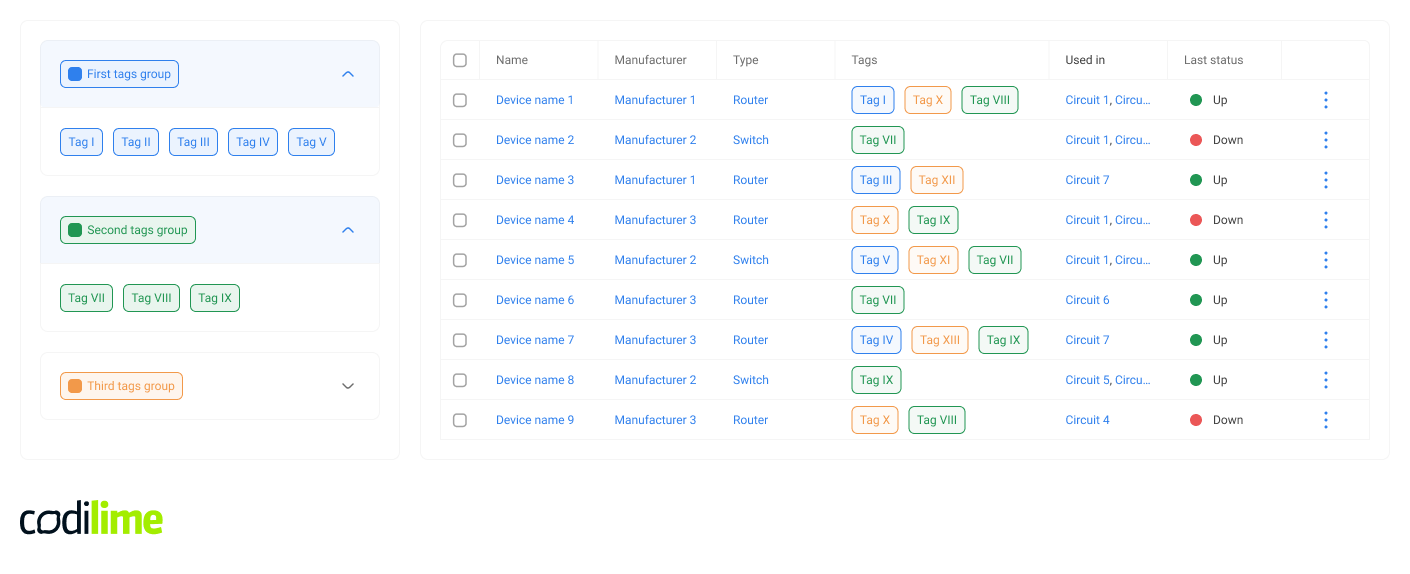
Once you've organizedthe data in the right buckets, you can design how you want to group them. Are your users most familiar with tags, tabs, or cloud-deployed applications with the ASCI interface? It’s crucial to carefully pick a way to visualize the data that meets your users’ expectations. Also, it's important not to overwhelm users with too much information at once. Our studies show that statistical user prioritize clarity over quantity.
Customize user interface for individual experience
Our experience shows that the users more likely tend to use an interface that could be customized by them and enable them to cover all the cases by its flexibility. Let them do that. Our way of seeing things may be perfect for us, but a user who has never encountered similar patterns won’t simply recognize them because that’s how the human brain works ![]() .
.
Not every data we have is required at first glance, and we can always use a drill-down (but not too deep). We need to avoid the cognitive load ![]() like the plague. Monitoring applications are filled with data, ironically making them harder to read and understand.
like the plague. Monitoring applications are filled with data, ironically making them harder to read and understand.
Also, simply copying the features your competitors have may not be suitable for your users (it may not even be suitable for their users).
When you have all of the above set up right, you can pinpoint the details. Have you considered a dark mode to satisfy the night-shift users?
Act in response to the needs of your users
What should we do when we have our data managed? Make your users’ work as easy and as manageable as it could be. This involves addressing common day-to-day questions, such as: Where can they create a monthly performance report? What to do when they want to share a result with their colleague? How to set up a custom alert? By doing so, we make sure that the product meets users expectations.
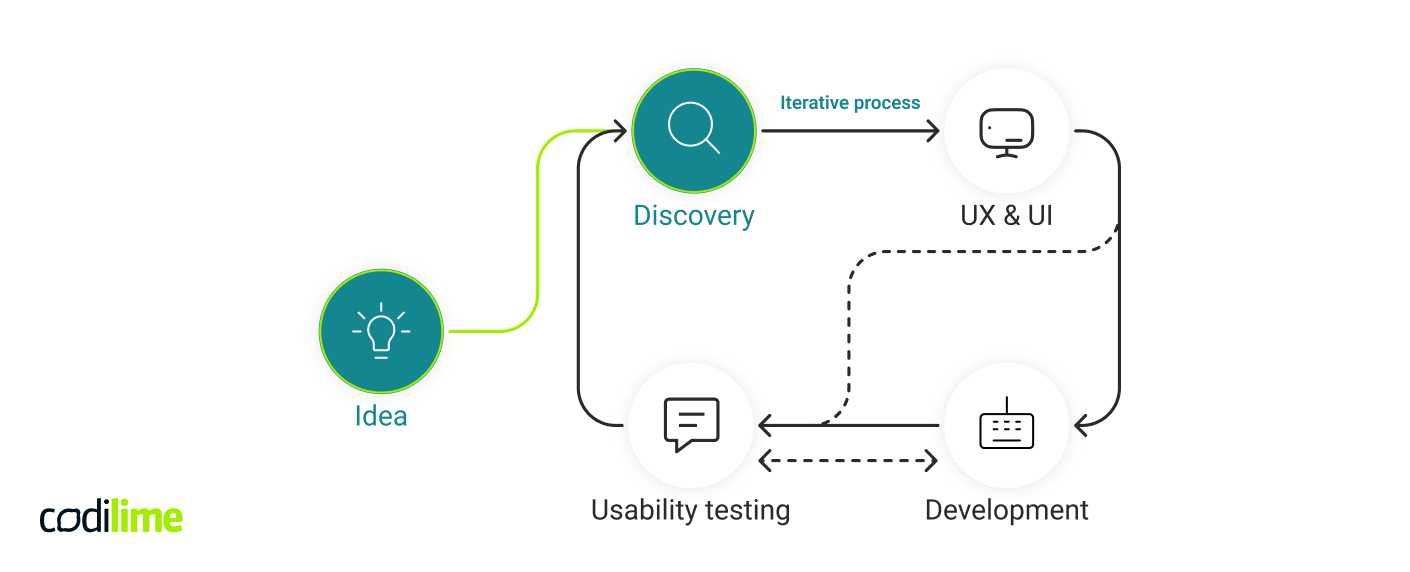
This article is related to the part of our Product Design process - Idea and Discovery.
LEARN MORE ABOUT OUR PROCESS HERE >>
Enhance users' experience and boost your business
Every tool is designed to make people’s lives easier. By following these simple steps, you’ll not only simplify the lives of your users but also greatly benefit your business. It may reduce task execution time, improve user retention, and definitely will increase customer satisfaction, aseverything they’re looking for is obtainable in an easy and accessible way.


