


Any company dealing with software development knows the importance of reliable infrastructure. Whether you have multiple environments for testing and production which are needed to allow your own teams to work without interruptions or you provide mobile or web services to customers, you will have to keep an eye on your systems. So it goes without saying, you will need a good monitoring system to make sure your systems and infrastructure keep performing as they should.
But modern monitoring systems provide tons of raw data when the performance metrics are collected. If you try to observe all the available metric data, you might end up lost in a sea of data and miss out on the important data points. We have prepared some essential monitoring, metrics, and alerting information to help you develop a great monitoring strategy and get real value from your monitoring system. Let's see what metrics and monitoring are all about!
Main elements of a monitoring system
Nowadays, multiple monitoring tools provide robust capabilities for effective monitoring and gathering data. The exact set of features each monitoring system offers might vary significantly, but most of them also work as alerting systems.
By default, a monitoring system is an automated system that allows you to collect metrics that describe different aspects of your infrastructure’s state and performance, watch for specific metric values, and set alerts to inform your monitoring team when something happens. Monitoring is a crucial element of keeping your systems working as they should. Gathering the right data can help you detect anomalies in a system’s behavior and quickly react to fix the situation.
The collected metrics can also usually be analyzed when a specific issue needs troubleshooting. Many monitoring systems also have data visualization capabilities, which means they provide insight that, for example, can help you to plan system maintenance and updates.
However, regardless of additional features, when you set up a monitoring system, you can count on getting the means to implement the actual monitoring process, metrics collection, and alerts configuration. We will take a closer look at each of the components to understand what you need to pay attention to when choosing the best monitoring system for your business needs. Learn more about our end-to-end monitoring services here.
For more information about data monitoring and its importance, check out our previous publication, where we covered the crucial role of data monitoring.
Metrics
Understanding how monitoring works is impossible without knowing what exactly is the data we are supposed to be looking at. Metrics are the raw data that is collected in the process of monitoring. Any of the services or applications that comprise your infrastructure can output metrics that help to understand their behavior, state, resource usage, and other parameters.
There are different ways monitoring metrics are collected. This can involve a monitoring agent, or serverless monitoring applications can function without one. You can also get the metrics on different levels, from the low-level data provided by your operating system regarding CPU usage, used memory, or available disk space, to high-level metrics that can be specific to a certain service or even your company in general.
Metrics monitoring can include data from multiple data sources; many web servers, applications, database servers, sensors, and other components of infrastructure also produce their own metrics. Some metrics can be passed on to the monitoring system without any extra work, but sometimes you might need some additional coding to expose application metrics or organize them, especially if it is your own software.
The importance of monitoring metrics is immense. Raw data that you collect can be used as basic values to track changes in resource consumption and systems performance or correlate data and learn historical trends. Different metrics sources can provide detailed information about every component in your production and deployment environment.
Types of metrics
There are multiple classifications of metrics a monitoring system can track. One of the most widespread systems divides metrics into several types based on the role that the source of the metrics plays in your infrastructure from a hierarchical point of view.
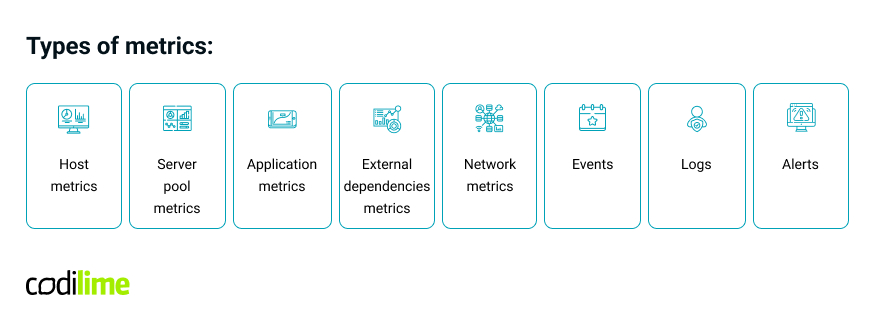
Host metrics
Host-based metrics typically include every kind of data that is related to the performance or health of a single computer that is a part of your infrastructure. If you want to know what exactly affects the ability of an individual computer to perform certain tasks or remain stable, you need to monitor host-based indicators. As a rule, these usage and performance metrics include data from hardware or the operating system, such as memory, disk space, processes, and CPU metrics.
Server pool metrics
Although collecting data about a single computer or web server is important, if your infrastructure is scaled horizontally, you will also need to keep an eye on server pools. The metrics that describe the health and performance of collections of homogenous servers are the key to understanding how your system is able to respond to changes and handle workloads. Server pool metrics typically include scaling adjustment metrics, pooled resource usage, the number of running and degraded instances, and other parameters.
Application metrics
The next level of metrics monitoring concerns applications, services, and any other units of work or processing that rely on the resources on the host or server pool level. The exact metrics you would want to monitor here depend on the specific functionality of the application or service, including its dependencies, and what other services it communicates with, etc. To make sure your service or application functions efficiently and correctly, you might need to collect metrics like average response time, service failures and restarts, error rates, load time, and other metrics that describe the application's health and performance.
External dependencies metrics
In modern applications, it is quickly becoming a norm to use external services to help your own service or app to work correctly. Your mobile or web application can communicate with external services in different ways, most often via APIs. Monitoring metrics related to external dependencies helps you to identify problems on the side of external service providers that can actually impact the operations of your own services. These metric measures might include the availability and status of a certain service, its response speed, error rates, resource exhaustion, and so on.
Network metrics
Another set of important aspects that are crucial to monitor in multiple different types of infrastructure are network and connectivity metrics. In many systems, network performance has the most significant impact on the user's experience. Your application might have a perfect design, but if it is offline, customer satisfaction will plummet.
Besides outward-facing availability, network metrics monitoring is important when you have a complex system with multiple servers, and certain services should be available for multiple machines. When you monitor these metrics, you can identify potential performance issues with connectivity, determine the ones with the strongest impact and prioritize solving them, optimizing resource usage. Network metrics monitoring usually covers bandwidth usage, throughput and packet loss rates, latency, and other indicators.
Events
For many monitoring systems, metrics are not the only kind of data that can be gathered. While metrics, as a rule, are gathered continuously, once in a set period of time, for example, once an hour or even once a minute or second, most monitoring systems can also capture events.
Singled out as a separate class of monitoring metrics, events differ by having no defined period of time when this kind of data can be tracked. The monitoring system receives information about events as they happen.
One other significant difference is that metrics typically need to be compared to other metrics to gain some insight because, taken separately, every measurement is just a data point. Events actually can be analyzed on their own, most often, they include detailed information on what exactly happened, when, and in what part of the system. This is why alerts are often triggered based on specific events.
Often events are reviewed together with metrics when looking for the cause of a certain problem because they provide more context and make it easier to pinpoint the root of the issue. An example of an event is any significant change in the system, like build release or failure, an increased or reduced number of hosts when the system is scaled, etc.
Logs
It is worth mentioning log files to better understand how a good monitoring system works. Metrics allow you to understand the current system performance and see the general trends, while logs are where the historical data is preserved. This systematized information on everything that happened with your environment makes troubleshooting much easier.
Although logs can be useful, going through them manually is highly ineffective. This is why log monitoring capabilities are also nice to have in a monitoring system. It allows you to get the trail of events recorded in the log files reviewed automatically and receive alerts only when the recorded events meet certain criteria.
Alerts
We have already mentioned alerts a couple of times, so let's see how exactly an alerting system works. An alert is how your monitoring system lets you know something important happens. The definition of each alert typically consists of two components. The first one is alert conditions, which describe the exact metrics value or threshold when the alert is supposed to happen.
The other component of alerts is what action should be performed when the alert rule conditions are met. In most monitoring systems, you can set different actions based on alert severity. Often it is enough to set some automated actions to avoid the worst consequences of certain events. For example, you can have a script that will automatically scale the respective application layer if CPU usage increases. But some complex issues can only be resolved with human intervention.
Alerts usually contain detailed information that will help with identifying problems and solving them. When a person responsible for monitoring receives the alert, they can, for example, also see where in the system and when exactly the metrics reached the threshold. This data guides them to the next steps in the investigation, like reviewing specific logs, and after the problem is discovered, the monitoring specialist will be able to implement a particular mitigation strategy.
So alerts are essentially how your monitoring system reacts to threshold violations. You can set as many alerts as you wish; however, you have to be careful when defining them so as not to receive false alerts that don't contain any useful information, or just too many alerts, as your monitoring specialists won't be able to distinguish between the really important issues and those that can be safely postponed. These issues can lead to alert fatigue, and, as a result, your team might start ignoring alerts completely. The main idea behind an alerts system is to make sure your team saves time and pays special attention only to those events that truly demand it.
What kind of system do you need for monitoring?
A good system for metrics monitoring allows you to process streams of data from different sources and convert them into useful insights that you can act on. If you want to ensure effective monitoring though, there are certain functions you might want your system to have.
It is quite obvious that your monitoring tool should be able to collect data without any data loss and scale easily, as there can be thousands or tens of thousands of metrics that need to be monitored. But older data should not be just discarded because analyzing only the current information won't help you to distinguish important trends that happen over longer periods of time. So past values should also be stored securely and easy to aggregate as a summary when an analysis is required.
Some tools also provide additional capabilities, like collecting statistics on the monitored metrics or generating graphs to facilitate data visualization. These features also help you to gain business value from the monitoring of your infrastructure.
Choosing the right monitoring metrics
Even with the best monitoring tool, however, you might not be able to identify issues and resolve them efficiently if you are not sure what the right data is, meaning which types of metrics you actually need to collect. Effective monitoring is all about the right kind of metrics. There are a number of parameters that define high-quality useful data that might help you determine which system you need for monitoring.
Easy to understand
Your system for monitoring should classify and mark the collected data in such a way that you won't spend extra time trying to find out what exactly certain metrics or events mean, when this data was recorded, etc. Using clear titles for events and metrics and just in general keeping them simple will help you in case of emergency when every second counts.
Tagged conveniently
The scope of data is important because your hosts typically operate in multiple scopes at the same time. Tagging data by scope helps to set meaningful alerts and to aggregate data to analyze your infrastructure health and performance. You want to have multiple scopes associated with your metrics to avoid being limited by a fixed host hierarchy, and it will help you investigate and resolve outages faster.
Collected frequently
Depending on the source of data, you might want to collect new metrics with different frequencies. For certain indicators like critical peak server loads, you might need to observe your web servers for a longer period of time to uncover the right data in the middle of average values. But for other tasks, extreme granularity might be redundant and will only serve as the source of extra load on data storage and system performance.
It might take some time to determine the right intervals for all your metrics, but it is an investment that will definitely pay off, as your monitoring results will be truly meaningful. You don't want to collect metrics too often as it will result in creating noise in the data from your monitoring and make it more difficult to reach your monitoring goals.
Stored longer
Different monitoring systems can store the raw data for different periods of time by default. It might seem that discarding the stored data sooner is a good way to reduce costs, as you get to free the storage disk space that can be used for storing new metrics. However, this way, you also might lose some important older data that can be useful for uncovering certain rare events that occur once a season or even once a year.
It doesn't mean that you have to store all of your collected data for years, though. When you develop your monitoring strategy, just take some time to determine the storage time for different types of metrics carefully. There are definitely some of them that can be discarded earlier than others.
What else do you need to consider?
There are other factors you will have to take into consideration too, of course, when choosing what metrics to observe, for example, your own resources available for monitoring. Budget constraints will always play a significant role when you decide what metrics to track. You might also find that your team is overloaded, so there are not enough human resources to provide timely intervention when alerts happen. That is something you will have to decide how to deal with.
Your applications and services' complexity will also have a certain impact. The metrics that are crucial to monitor for one application could be useless to track for another one. Moreover, the importance of the metrics themselves might change over time. It is good practice to re-evaluate the set of data that you collect regularly to see if the metrics you track are still the ones that are the most meaningful.
Conclusions
Having a solid monitoring system is, no doubt, one of the priorities for any business dealing with software development. Without monitoring metrics and events, you can't be sure you will be able to identify issues and develop solutions quickly enough to prevent any serious damage to your infrastructure and, respectively, customer satisfaction and potential revenue.
Whether you choose a third-party monitoring tool or develop your own custom solution, make sure it works for your own needs and can collect and visualize the metrics that are especially important for your organization. With the right data collected, it is easy to get the most business value from metrics monitoring and ensure the best possible performance of your applications, services, and environments.


