


Software development is a complex process that requires a lot of effort to successfully launch a new product. Hoping for the best might be risky. That is why it is important to measure the right key performance indicators (KPIs) to meet project requirements, satisfy your clients or measure your own goals within a software company. By monitoring KPIs, you can identify areas of improvement and make better data-driven decisions.
In this article, we will discuss software development KPIs that you should measure to achieve the best results.
What is a software development KPI?
Before delving deeper into the KPIs that should be measured, it is important to understand what KPIs are in terms of software development.
A key performance indicator (KPI) is a measurable value that helps organizations understand how well they are achieving their business objectives. In software development, KPIs are used to track and measure the performance of a software development team and ensure that the product meets the client’s needs and their business value, or your own business goals.
KPIs are important in software development because they provide a way to track progress and identify areas that require improvement. By measuring KPIs, organizations can make data-driven decisions and focus on areas that will have the greatest impact on the success of the product.
There is a wide range of KPIs that can be used to measure the performance of software development teams. The specific KPIs that are used will depend on the organization's goals and the specific goal of the product. In the next part of the article, we will focus on the importance of KPIs and the most common KPIs used in software development.

Why are key performance indicators important?
KPIs are important in software development because they help measure specific team performance and, when used properly, provide answers to many possible issues. They can help development teams prioritize tasks and allocate resources more effectively.
For example, they provide a way to track the progress of software development projects. By measuring key performance indicators, development teams can see how well they are meeting their goals and adjust their strategies accordingly.
It also helps maintain good teamwork. By measuring KPIs and metrics, development teams can communicate progress and performance to other stakeholders, including management, investors, and customers. This can facilitate collaboration and ensure that everyone is on the same page to aim for customer satisfaction and achieve business success.
Additionally, increased accountability often results when KPIs are used in the software development process. KPIs and metrics provide a way to hold teams accountable for their performance. By tracking the team’s performance against established KPIs, development teams can ensure that they are meeting their goals and making progress toward achieving their business objectives.
What are the benefits?
Measuring KPIs in software development offers numerous benefits that can significantly contribute to the overall success of a project. Firstly, by tracking and analyzing these performance indicators, development teams can identify strengths and weaknesses in their processes, allowing for targeted improvements and better resource allocation.
Secondly, KPIs serve as a valuable communication tool between team members, stakeholders, and management, ensuring a clear understanding of the project's status, goals, and progress. This fosters collaboration and helps maintain alignment across the organization.
Thirdly, by establishing and measuring KPIs, teams can set realistic expectations and avoid potential disappointment, ensuring that project timelines and budgets remain on track. Lastly, KPIs promote a culture of continuous improvement, as teams are encouraged to constantly evaluate and optimize their processes to achieve higher levels of efficiency and productivity. KPIs in software development are essential for driving better decision-making, enhancing collaboration, and ensuring the successful delivery of projects that meet both customer and business objectives.
Software development KPIs

There are many types of KPIs, but in this article, we want to focus on key metrics that might be useful in the software development process and help you with priorities on setting software development KPIs.
Efficiency and workflow metrics
-
Flow efficiency
Flow efficiency is an extremely useful metric for software development. It helps measure the efficiency of a team's workflow. It is a measure of the percentage of time that work items are actively worked on, as opposed to being blocked or waiting in a queue.
Flow efficiency is an important metric because it provides insight into how efficiently a team's workflow is operating. If a team has a low flow efficiency, it may indicate that work items are frequently becoming blocked or that there are some issues in the workflow that need to be addressed. By tracking flow efficiency over time, teams can identify areas for improvement and optimize their workflow to increase efficiency.
Measuring flow efficiency in practice involves tracking the time spent on different stages of a task's lifecycle. To calculate flow efficiency, you can use the following formula:
Flow Efficiency = (Active Work Time / Total Time) 100%*
For example, let's say a task spends 8 hours in active development, 4 hours waiting for review, and 2 hours in review. The active work time would be 8 + 2 = 10 hours, while the total time would be 8 + 4 + 2 = 14 hours. The flow efficiency would be (10 / 14) * 100% ≈ 71%.
By measuring flow efficiency and analyzing the results, teams can identify bottlenecks and areas for improvement in their development process, ultimately leading to more efficient workflows and increased productivity.
-
Interruptions
In certain circumstances, it may become necessary to pause ongoing work temporarily. While this might be expected in a production environment, it is generally undesirable in software development, particularly when tasks are estimated to take 2-3 days to complete.
Interruptions may be measured as the number of interrupted tasks in a given period of time. Good practice is to measure not only tasks that were interrupted but also each interruption for a given task.
For example, let’s say there are two tasks that were interrupted by other high-priority work in the given time period. The first task was interrupted once. The second one was interrupted 3 times. That gives 4 interruptions in the given time period. Good practice is to use a clear indicator for interrupted tasks. A dedicated status, a flag or a label work for dedicated management software. When using a physical task board you may consider using stickers or stamps.
Interruptions can disrupt the progress of tasks and reduce overall throughput. In a dynamic startup environment, it is essential to proactively manage interruptions by investigating the reasons behind halted tasks and establishing preventive measures.
The frequency of interrupted tasks within a specified time frame serves as a valuable metric. By measuring and monitoring this metric, teams can work towards reducing interruptions and enhancing productivity. It is crucial to focus on minimizing disruptions, as they can have a detrimental impact on your team's overall performance and efficiency.
-
Development velocity
Development velocity, also known as sprint velocity or team throughput, is a metric used in agile methodologies to measure the rate at which a development team is able to complete work during a specific time period, typically a sprint or a week.
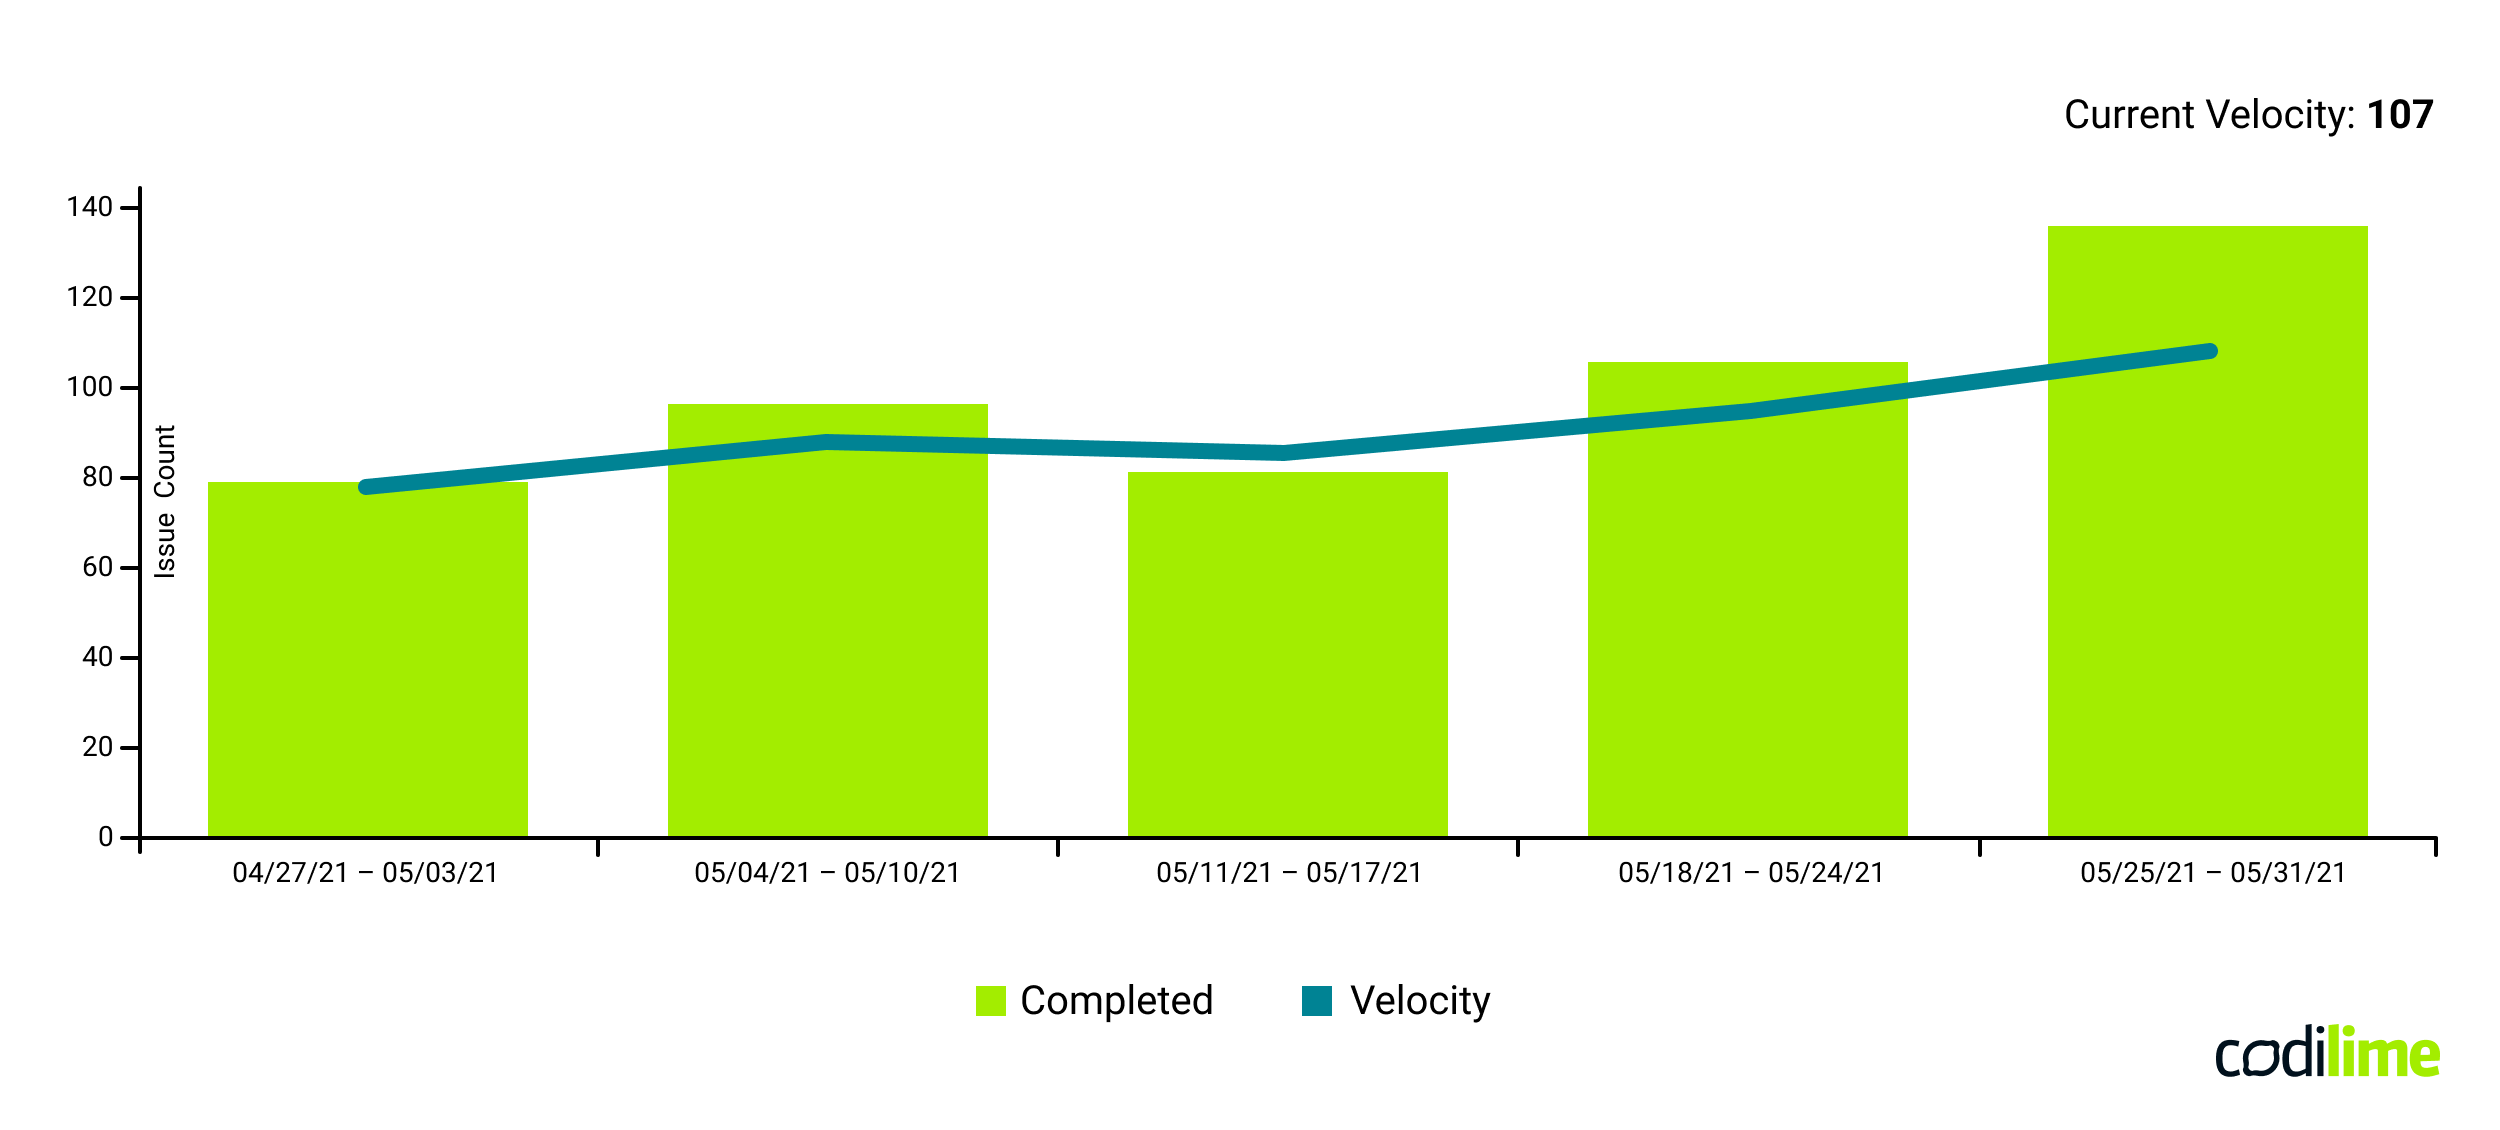
Development velocity is calculated by totaling the number of story points or other units of work completed by the development team during a sprint and dividing it by the number of working days in the sprint. For example, if a team completes 40 story points during a 2-week sprint, their development velocity would be 4 story points per day. As any mean value such simplification may be used only for long-term estimations. For short-term planning such numbers may be used as guidance influenced by multiple factors.
-
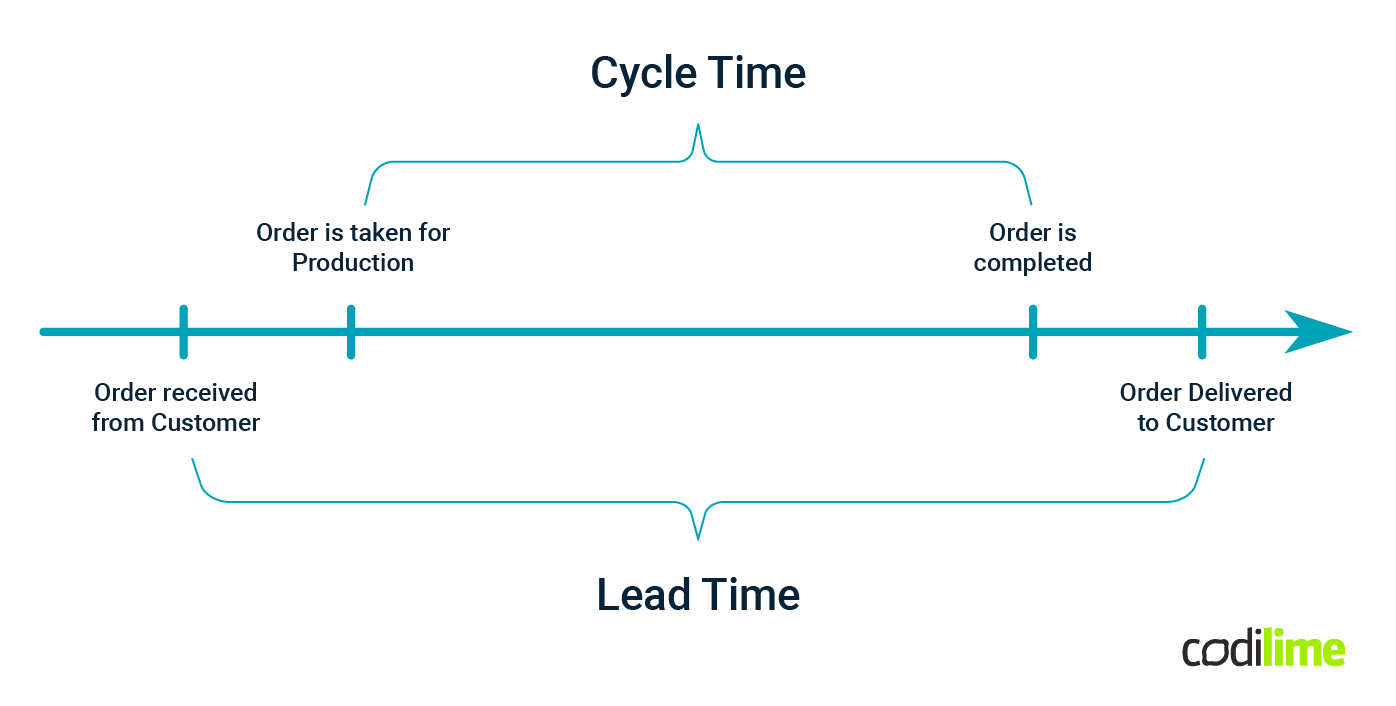
Cycle time
Cycle time measures how much actual work time is spent on a single task, from the moment it starts until it is completed. It provides insight into how quickly work is being completed and how efficiently the development process is functioning. It is also one of the most popular software development KPI metrics because it helps to manage the development process by studying cycle time charts.
By measuring and analyzing cycle times, development teams can identify inefficiencies in their processes, prioritize tasks more effectively, and ultimately improve their overall productivity.
-
Lead time
Lead time measures the total time it takes for a task, feature, or user story to move from initial request to completion. Unlike cycle time it encompasses the entire development process, including the time spent in waiting or backlog queues, active work on the task, and any reviews or approvals required before the task is considered finished.
Lead time is particularly important for understanding the overall efficiency of your development process and the responsiveness of your team to customer needs or changing requirements. By measuring lead time, you can identify bottlenecks or inefficiencies in your workflow and take steps to optimize the process, ultimately shortening the time it takes to deliver new features or updates to your customers.
We have also discussed cycle time in the three software development metrics for a startup environment.
-
Wasted effort metric
This metric quantifies the amount of time and resources spent on tasks that ultimately do not contribute to the final product. It includes the effort invested in rewriting code, exploring abandoned ideas, and working on features that are later canceled. You can calculate this metric by tracking the time spent on such tasks and then converting that time into monetary costs, considering factors like employee salaries, overhead, and other expenses.
For example, imagine a software development team working on a feature that is eventually deemed unnecessary and scrapped after two weeks of development. If the team consists of four developers, each with an hourly rate of $50, the wasted effort for this task would be calculated as follows:
2 weeks * 5 days/week * 8 hours/day * 4 developers * $50/hour = $16,000
To measure this metric you may consider a clear visualization of tasks that were scrubbed. One of ways is to use a label and a dedicated board with a swimlane (created using the mentioned label) that clearly visualizes what tasks were scrubbed.
By monitoring the wasted effort metric, you can gain insights into the efficiency of your development process and identify areas where you can reduce waste, improve decision-making, and optimize resource allocation. Additionally, this metric can help you prioritize tasks and features more effectively, reducing the likelihood of investing in efforts that will not yield returns in the long run.
You can use this metric as a cumulative metric for each stage of the development process or in time slots that fit your organization's pace of development. For instance, you may choose to calculate the wasted effort metric for each sprint, project, or quarter to identify trends and make necessary adjustments to your development strategy. By doing so, you can continually refine your processes and minimize wasted effort, ultimately leading to greater efficiency and a more successful product.
Code quality metrics
-
Code coverage
Code coverage is used by software developers to measure code quality. It measures how much of the source code has been tested and is expressed as a percentage.
Code coverage is typically measured using a code coverage tool, which can analyze the code and determine how many code lines or which blocks of code were executed during testing. If code coverage is low, it may indicate that there are areas of the source code that have not been adequately tested and may contain defects that could impact the functionality or reliability of the application.
However, high code coverage does not necessarily mean that the testing process is effective. It is possible to achieve high code coverage without fully testing all aspects of the application, such as edge cases or error handling.
It should be noted that code coverage works best in conjunction with other metrics.
-
Code Simplicity
This KPI metric is hard to measure, however it provides an important insight into your product’s success. Good code practices keep code organized and easy to understand. Simple code is better than complex code because it is much easier to modify and maintain. Also, more complex code is usually time-consuming, high maintenance, and expensive, which has a major impact on the software product’s efficiency and development cost.
One way to measure code simplicity is by using quantitative metrics, such as the Cyclomatic Complexity metric ![]() . Cyclomatic Complexity measures the number of independent paths through the source code, with lower values indicating simpler code. For example, a method with a Cyclomatic Complexity of 3 has three different execution paths, while a method with a Cyclomatic Complexity of 10 has ten different paths. Lower complexity values generally indicate code that is easier to understand and maintain.
. Cyclomatic Complexity measures the number of independent paths through the source code, with lower values indicating simpler code. For example, a method with a Cyclomatic Complexity of 3 has three different execution paths, while a method with a Cyclomatic Complexity of 10 has ten different paths. Lower complexity values generally indicate code that is easier to understand and maintain.
Another approach to measuring code simplicity is by conducting code reviews and using qualitative assessments. Developers can review each other's code, evaluating its readability, maintainability, and adherence to coding standards. This peer review process can provide valuable insights into the simplicity of the code and identify areas that require improvement or refactoring.
Additionally, tools like static code analysis and linters can be used to identify common code smells ![]() , which are patterns in the code that may indicate poor design or increased complexity. By addressing these code smells, you can work towards creating simpler, more maintainable code.
, which are patterns in the code that may indicate poor design or increased complexity. By addressing these code smells, you can work towards creating simpler, more maintainable code.
To make code simplicity a measurable metric, you can assign values to various aspects of the code, mentioned above, and apply these values consistently across the development process. For instance, during code reviews, you could establish a scoring system to evaluate the simplicity of the code based on factors such as readability, maintainability, and adherence to coding standards. This scoring system can be used by developers to assess each other's code, providing valuable insights into areas that may require improvement or refactoring.
Measuring code simplicity can involve a combination of quantitative metrics, qualitative assessments, and the use of various tools to ensure that your code is easy to understand, modify, and maintain, ultimately contributing to the overall success of your software product.
Progress and performance tracking metrics
-
Sprint burndown
Another software metric is the sprint burndown, which visualizes a sprint's completed work and compares it with its total scope. You can use this metric to track progress toward sprint completion. By using sprint burndown as a metric, software development teams can identify discrepancies between predicted and actual progress and adjust teams’ performance accordingly. Sprint burndown charts are often used by development teams to track the time taken to complete story points. They may give you insight into the team’s way of working and detect workflow bottlenecks.
-
Release burndown
Release burndown is a visual tool used to monitor the progress of a software release throughout its development lifecycle. It is a chart that displays the amount of work remaining in a release and the rate at which that work is being completed.
A typical release burndown chart consists of a horizontal axis representing time, usually divided into sprints or other units of time, and a vertical axis representing the amount of work remaining in the release, often measured in story points or tasks. As the team progresses through the development timeline, the chart will show a downward trend, indicating that the work is being completed and the remaining workload is decreasing.
This chart can be used for several purposes, such as:
- Tracking progress: By monitoring the release burndown chart, teams can ensure that they are on track to meet their release deadlines and identify any potential bottlenecks or delays in the development process.
- Forecasting completion: By analyzing the rate at which tasks are being completed, teams can estimate when the remaining work will be finished, allowing them to predict the release date more accurately.
- Identifying areas for improvement: Release burndown charts can highlight issues in the development process that may be impacting the team's ability to complete work efficiently. By addressing these issues, teams can optimize their workflow and improve their overall performance.
- Communicating progress to stakeholders: The visual nature of the release burndown chart makes it an effective tool for sharing progress updates with stakeholders, such as management, investors, or clients, ensuring that everyone is informed and aligned with the project's goals and timelines.
By utilizing release burndown charts, software development teams can gain valuable insights into their progress, make data-driven decisions, and ensure the timely and successful delivery of their product.
-
Cumulative flow

Cumulative flow is a visual tool used in software development to track the flow of work items through different stages of the overall development process over time. It is a graph that shows the number of work items in each stage of the workflow. In many software projects, the cumulative flow is divided into specific sections, such as “Backlog”, “In progress”, “In review”, and “Approved” to keep better track of the work.
The cumulative flow chart can be used to predict the completion date for a software project. By analyzing the rate at which tasks are moving through the workflow, teams can estimate the time it will take to complete the remaining work and other future tasks.
Common pitfalls
Despite the numerous benefits of measuring KPIs for software development, there are challenges and potential pitfalls that can hinder the effectiveness of these metrics. One such challenge is the selection of the right KPIs to accurately reflect the project's goals and provide actionable insights. In some cases, teams may focus on measuring what is easily quantifiable rather than what is most relevant to their project's success. This can lead to a misalignment of priorities and a lack of focus on the key areas that require improvement.
Another challenge is the risk of overemphasizing certain KPIs, which can create an unbalanced view of a project's progress. For instance, an excessive focus on development velocity may encourage teams to prioritize speed over quality, resulting in a product that is delivered quickly but fails to meet customer expectations. It is essential to maintain a balanced perspective and consider multiple KPIs to ensure a comprehensive understanding of the project's status.
To mitigate the challenges and potential pitfalls of measuring KPIs, it is crucial for teams to regularly review and reassess their chosen metrics, ensuring that they remain relevant and aligned with project goals. Additionally, fostering open communication and collaboration among team members and stakeholders can help maintain a balanced perspective and facilitate the identification of potential issues before they escalate. By adopting a proactive and adaptable approach to KPI measurement, software development teams can maximize the benefits of these metrics and drive their projects toward success.
Vanity metrics
Vanity metrics are a type of performance indicator that, while seeming impressive at first glance, may not necessarily provide meaningful insights into the true health or success of a software development project. These metrics can often be misleading as they may not be directly linked to the actual progress or effectiveness of the project. Instead, they might simply create a sense of achievement without providing actionable data to drive improvement or informed decision-making.
Examples of vanity metrics in software development include:
- Number of lines of code (LOC): While a large number of lines of code might suggest that a team is actively working on a project, it doesn't necessarily correlate to the quality or efficiency of the code. A more compact, well-organized codebase may be more effective and easier to maintain than one with numerous lines of poorly written code.
- Number of commits: A high frequency of commits to a code repository might suggest an active development process. However, this metric does not account for the quality or impact of the changes made. A better measure of productivity could be the number of resolved issues or completed features that provide value to the end user.
- Number of test cases executed: A high number of test cases executed might give an impression of thorough testing. However, this metric doesn't provide information about the relevance or effectiveness of those tests in uncovering software defects or ensuring quality. Metrics like defect density or test case effectiveness can provide a more accurate representation of testing quality.
- Number of meetings or hours worked: Tracking the number of meetings held or hours worked by the development team might give an illusion of productivity, but it doesn't necessarily correlate to actual progress made on the project. Instead, focus on outcome-based metrics such as development velocity or completed features to gain a better understanding of the team's true productivity.
To avoid falling into the trap of focusing on vanity metrics, software development teams should prioritize the selection and monitoring of key performance indicators (KPIs) that are directly tied to their project's objectives and provide actionable insights. By concentrating on meaningful metrics, teams can make data-driven decisions, optimize their processes, and ensure the successful delivery of high-quality software products.
How to find the right metrics
Selecting the appropriate key performance indicators (KPIs) is essential for ensuring that your software development project aligns with your organization's vision and mission. The right metrics should reflect the process of achieving the highest value within the expected time horizon while also taking into consideration the unique context of your organization, such as its size, structure, and goals.
In this section, we will discuss the importance of choosing the right metrics depending on your organization type, such as a startup or a corporate environment, and explore additional topics relevant to selecting the most effective KPIs.
Deriving KPIs from vision and mission: When choosing KPIs, it's crucial to consider your organization's overarching vision and mission. The metrics you select should directly support your strategic objectives and help you measure progress towards achieving them. This alignment ensures that your development team's efforts are focused on activities that contribute to the organization's long-term success.
Balancing value and time: The right KPIs should help your team balance the achievement of maximum value with the expected time horizon for your project. To do this, consider metrics that capture both the efficiency and effectiveness of your development processes, such as development velocity, cycle time, and customer satisfaction. These metrics can help you optimize your processes to deliver the greatest value within the project's timeframe.
Adapting metrics to organization type: The specific KPIs you choose may also depend on the type of organization you are part of:
- Startup: In a startup environment, priorities often include rapid growth, innovation, and agility. KPIs that focus on responsiveness, learning, and adaptability, such as lead time, customer feedback, and iteration speed, can help startups measure progress and make data-driven decisions to accelerate growth.
- Corporate: In a corporate setting, priorities may include stability, predictability, and scalability. KPIs that emphasize efficiency, reliability, and compliance, such as defect rates, resource utilization, and regulatory adherence, can help corporate bodies maintain control and ensure long-term success.
When selecting the right KPIs, it's also important to consider the following:
Avoiding vanity metrics: As discussed earlier, vanity metrics may seem impressive but do not provide meaningful insights into the success of a software development project. Focus on KPIs that offer actionable data to drive improvement and informed decision-making.
Simplicity and clarity: Choose metrics that are easy to understand, measure, and communicate to stakeholders. This ensures that everyone involved in the project is aligned and working towards the same goals.
Continuous evaluation: Periodically review your chosen KPIs to ensure that they remain relevant and useful for your project. Be prepared to adjust your metrics as your organization evolves, as new challenges arise, or as you gain new insights into your development processes.
By carefully selecting the right metrics based on your organization's vision, mission, and context, you can ensure that your software development project stays on track and contributes to the overall success of your organization.
Conclusion
The above-mentioned software development KPIs outline the crucial metrics that need to be measured at each stage of development to ensure the success of a project. These KPIs enable you to streamline your work processes, increase efficiency, and simplify the development process. Additionally, they assist in evaluating how to align software development with established timelines and budgets, which is essential for the satisfaction of both your customers and your business.


