


Scrum metrics are a widely covered subject. You can find numerous articles on how to monitor sprint scope, goal, team velocity based on tasks estimated with story points, and interruptions during the sprint, to name a few. But what if you work in an extremely dynamic environment, such as a startup, where changes in directions, reassigning tasks and interruptions can occur every day or even more frequently? In this blog post, we will explain what software development metrics should be taken into account in a startup environment to ensure you keep on top of your project’s progress.
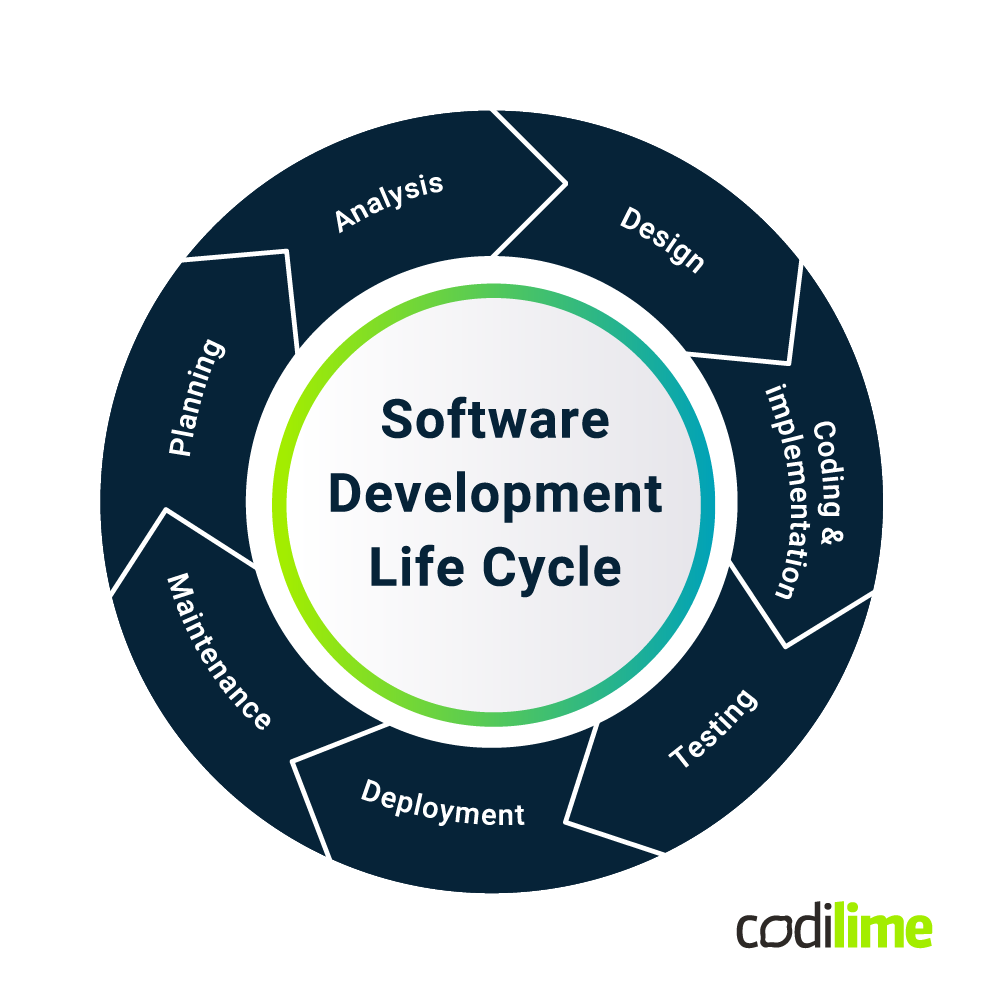
The software development process in startups
In the world of startups, the software development process is a critical component of achieving success. Choosing the right methodologies and processes is essential to ensure efficient product development.
This section will explore the key aspects of software development for startups and offer insights into how to make the most of them.
Types of software development processes
Startups have the flexibility to choose from various software development methodologies, each with its own unique advantages. Whether you opt for Agile, Scrum, Lean, or another approach, your choice should align with your startup's goals and specific requirements.
Check out our article on software product development types, methodologies, and processes for a comprehensive guide to these methodologies.
Agile software development
Agile development stands out as a popular choice among startups due to its flexibility and adaptability. It allows for iterative development, frequent feedback, and quick adjustments to market conditions.
The Agile mindset empowers startups to respond swiftly to user feedback and evolving business strategies.
However, the Agile approach is only one of several possible options. Check them out by reading our previous publication about SDLC methodologies.
Where Scrum is not enough
The Scrum ![]() approach is sometimes enough, but often not for startups, especially those building a new software product. A sprint’s scope and goals can change just one day after they have been agreed. Additionally, with a lot of research tasks it is hard to estimate effort, set up a clear deadline and foresee measurable results. Things that seem easy at first glance turn out to be complex and time-consuming.
approach is sometimes enough, but often not for startups, especially those building a new software product. A sprint’s scope and goals can change just one day after they have been agreed. Additionally, with a lot of research tasks it is hard to estimate effort, set up a clear deadline and foresee measurable results. Things that seem easy at first glance turn out to be complex and time-consuming.
So, how do we deal with this, and ensure we’re on the right track? Which agile metrics are most appropriate and give us clear insights into the project? To answer these questions, we’re going to look at three software development metrics that in our experience work best in a startup dynamic environment.
>> Check our outsourcing services and network environment services.
Tasks—how to treat them
When managing startup software engineering projects, story points or other methods of task effort estimation are usually difficult to implement, time-consuming and confusing. Team members, especially at the beginning of the project, have a different understanding of story points, different habits and approaches.
Additionally, time spent estimating is often wasted, as tasks are soon enough withdrawn, frozen or blocked, while others (not estimated during a refinement session) are introduced.
In the ever-changing environment that characterizes startups, Kanban trumps Scrum, and allows you to focus on finishing what has already been started. But to be able to finish, tasks should be short: completing them should take no longer than 2-3 days. So, it is better not to estimate tasks, but to ensure that stories are split into smaller chunks of work, or subtasks. Then we can start measuring.
Metrics for software development
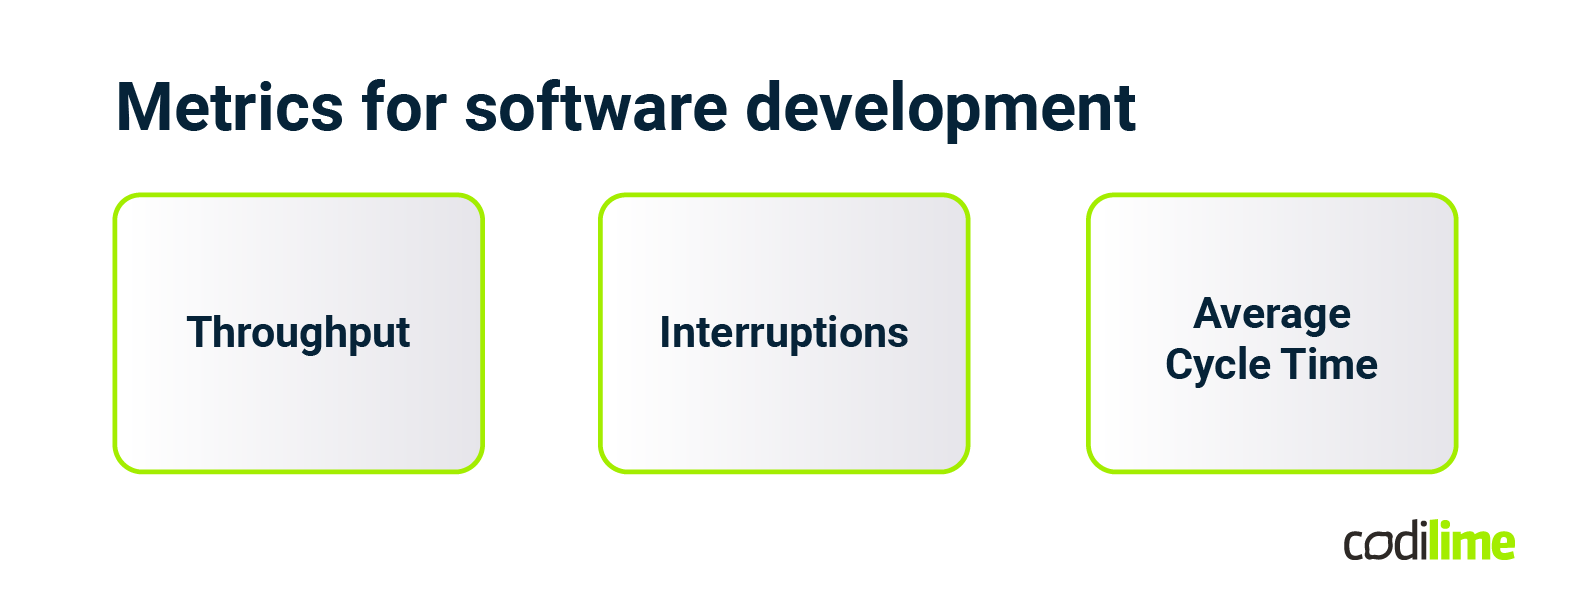
#1 Throughput—the most important metric
The ability to quickly react to constantly changing demands is essential in the agile approach. But sometimes this principle is understood incorrectly. It is not about immediately starting a new task when it pops up, but finishing what you’ve started and then moving on to your next-highest priorities, while taking capacity into consideration.
In a virtual world, however, we often fall into the trap of stretching our capacity too thin. We start a lot of tasks and then switch between them in an effort to complete them all at the same time. This context-switching not only stretches out the task completion, but causes more mistakes to be made—which take time to fix.
Given all this, the most important metric in the project is the number of tasks actually completed in a given period of time. This is how we should define throughput because ultimately only finished tasks matter. So, stop starting, start finishing!
#2 Interruptions
There might be situations where you have to stop what you’re working on at the moment. This may be true in a production environment, but in software development, especially when we have taks estimated for 2-3 days, it shouldn’t happen too often.
Interruptions jeopardize the processing of tasks and lower throughput. Controlling interruptions by checking why a given task was stopped should become a habit in a dynamic startup environment.
The number of interrupted tasks in a given period of time is our second metric. In some cases it might be necessary to account for subsequent interruptions of previously interrupted tasks. Measure it and work on decreasing this value, as interruptions negatively affect your team’s productivity.
#3 Average Cycle Time—the shorter, the better
In the Agile methodology, two time-related metrics are frequently mentioned. The first one is lead time, or the time that elapses from reporting the task to its completion. The second one is cycle time, the time that elapses from starting the task to its completion.
The first metric is often contingent upon the second. When a cycle time is shorter, and you complete tasks quickly and effectively, the queue of pending tasks decreases quickly. A smaller queue means that newly reported tasks are processed faster. The Average Cycle Time is thus very dependent on the Max Time—the time spent on the most time-consuming task. If you do a few tasks quickly, but one takes you too much time, the average time will also be stretched out.
So, stop frustrating yourself with a long list of pending tasks, but focus on splitting them into small chunks properly and finishing what you’ve started as quickly as possible. Smaller tasks are less likely to be interrupted, and bring faster results. The sense of accomplishment you feel when you achieve results will motivate you to move forward. So, measure your Average Cycle Time and do your best to shorten this time.
It’s important to remember that each task should be a meaningful piece of work. You should avoid splitting tasks for the sake of gaming metrics.
Why you should track metrics
Tracking metrics is not just a good practice but a fundamental necessity. Metrics provide valuable insights into the health and progress of the software projects. Below are some reasons for prioritizing metric tracking during the startup journey.
- Informed decision-making
Metrics offer a clear view of the product's performance, how users engage with it, and where improvements are needed. With this data, organizations can make informed decisions, allocate resources effectively, and pivot when necessary.
- Continuous improvement
Metrics enable identification of bottlenecks, spotting areas for optimization, and refining development processes. With this dynamic feedback loop, the team can continually track and analyze metrics to enhance the user experience and stay competitive.
- Attract investors
Tracking metrics demonstrates a commitment to data-driven decision-making and builds investor confidence. Metrics can become a persuasive tool in the pitch, showcasing the viability and scalability that convince investors.
Dependencies between metrics
Throughput, Interruptions and Average Cycle Time—these three software development metrics are equally important and can tell you a great deal about the progress of your software project. But you can also observe some dependencies between them. Average Cycle Time will not decrease if there are too many Interruptions or Max Time is too long.
Conversely, if Average Cycle Time increases, then Throughput will decrease—and you will have delivered less. If your Throughput and Average Cycle Time are low, you will have completed fewer tasks, but quickly. In an ideal world, of course, you’ll do more and do it quickly.
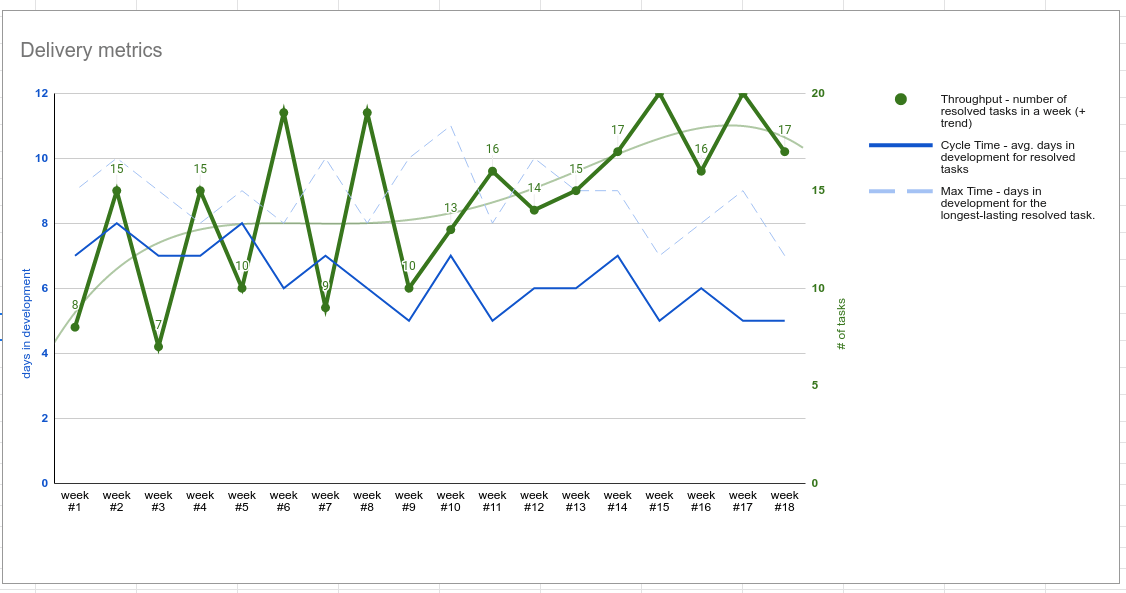
A good addition to tracking number of tasks is tracking trends to build insights and prepare yourself to react quickly to fluctuations in delivery speed (see Fig. 3).
How to track your metrics
Once you've learned which meaningful metrics are crucial and why it's important to track them, it's time to explore the various tools and methods available to effectively monitor and measure these metrics.
The Kanban method
The Kanban board ![]() with To Do, Blocked, In Progress, In Review, and Done statuses displays your pipeline of processed tasks. It is a powerful visual tool for managing the software development workflow, offering a clear representation of tasks and progress.
with To Do, Blocked, In Progress, In Review, and Done statuses displays your pipeline of processed tasks. It is a powerful visual tool for managing the software development workflow, offering a clear representation of tasks and progress.
Each startup might have slightly different Kanban board mapping steps for its software development process, depending on the relevant stages of work.
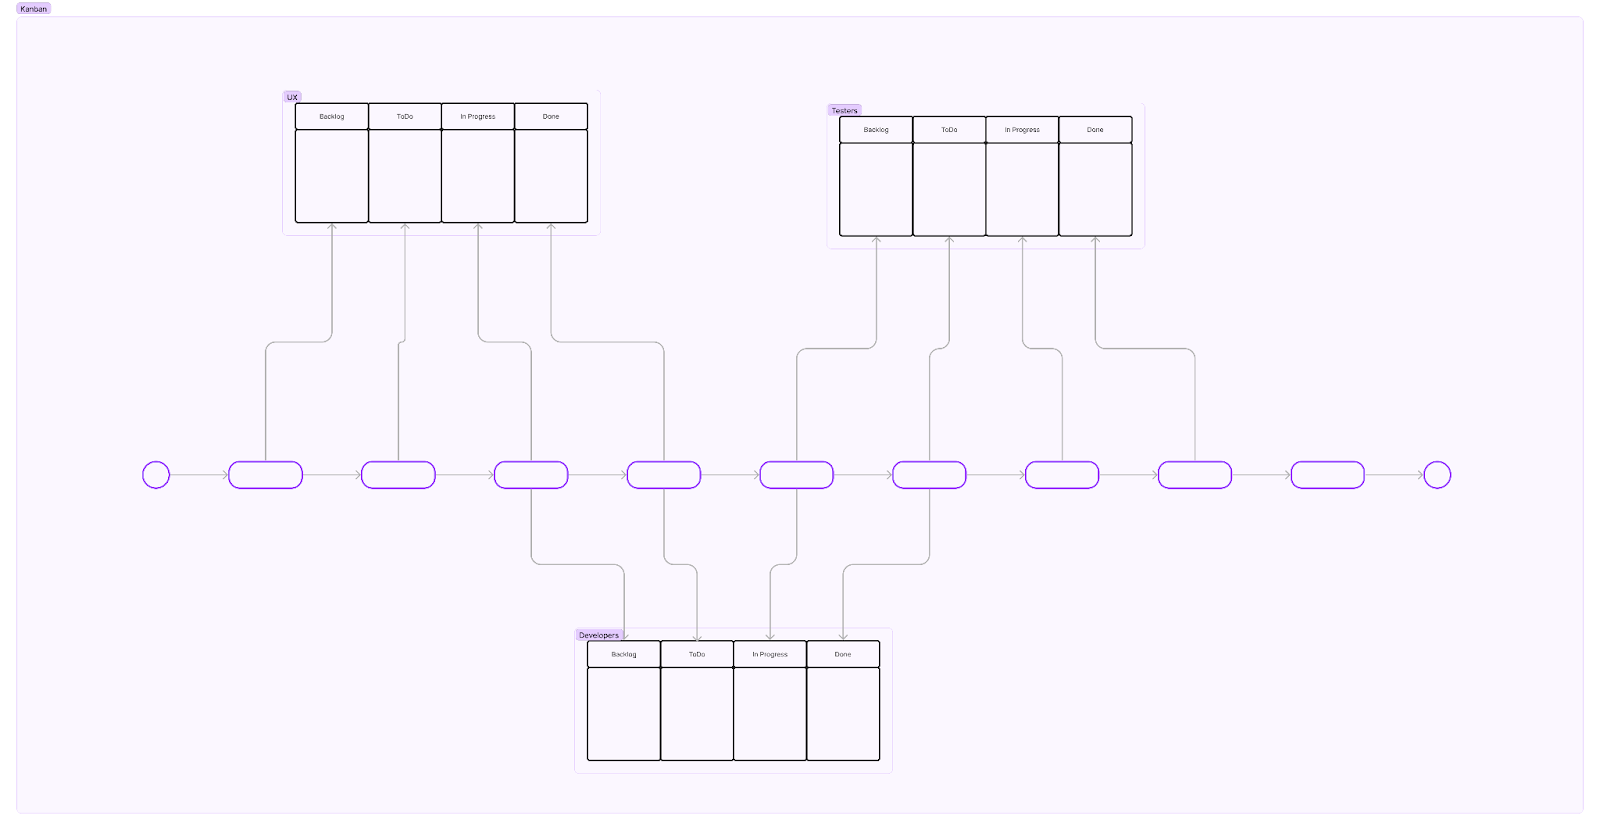
Each column on the Kanban board represents a distinct stage in your development process, from "To Do" to "Done." This visual depiction provides instant insights into task statuses and helps pinpoint bottlenecks.
Kanban emphasizes limiting the number of tasks in progress at any given time to promote focused work and faster task completion.
Another crucial metric is cycle time, the duration from "To Do" to "Done." It allows for assessing development efficiency, aiming for shorter cycle times to boost productivity. The "Blocked" column highlights tasks facing obstacles. Regularly addressing these issues keeps development on track by promptly removing hindrances.
Leveraging the Kanban board in a startup's development process offers a straightforward yet effective way to track metrics, improve efficiency, and maintain a competitive edge.
Jira reports to track the metrics
Jira is a powerful tool that has gained immense popularity in software project management. It uses the Kanban method and you can also set up limits for the number of tasks in a particular column (WIP—work in progress), so the system will help you keep the good practice of finishing open tasks before starting up another.
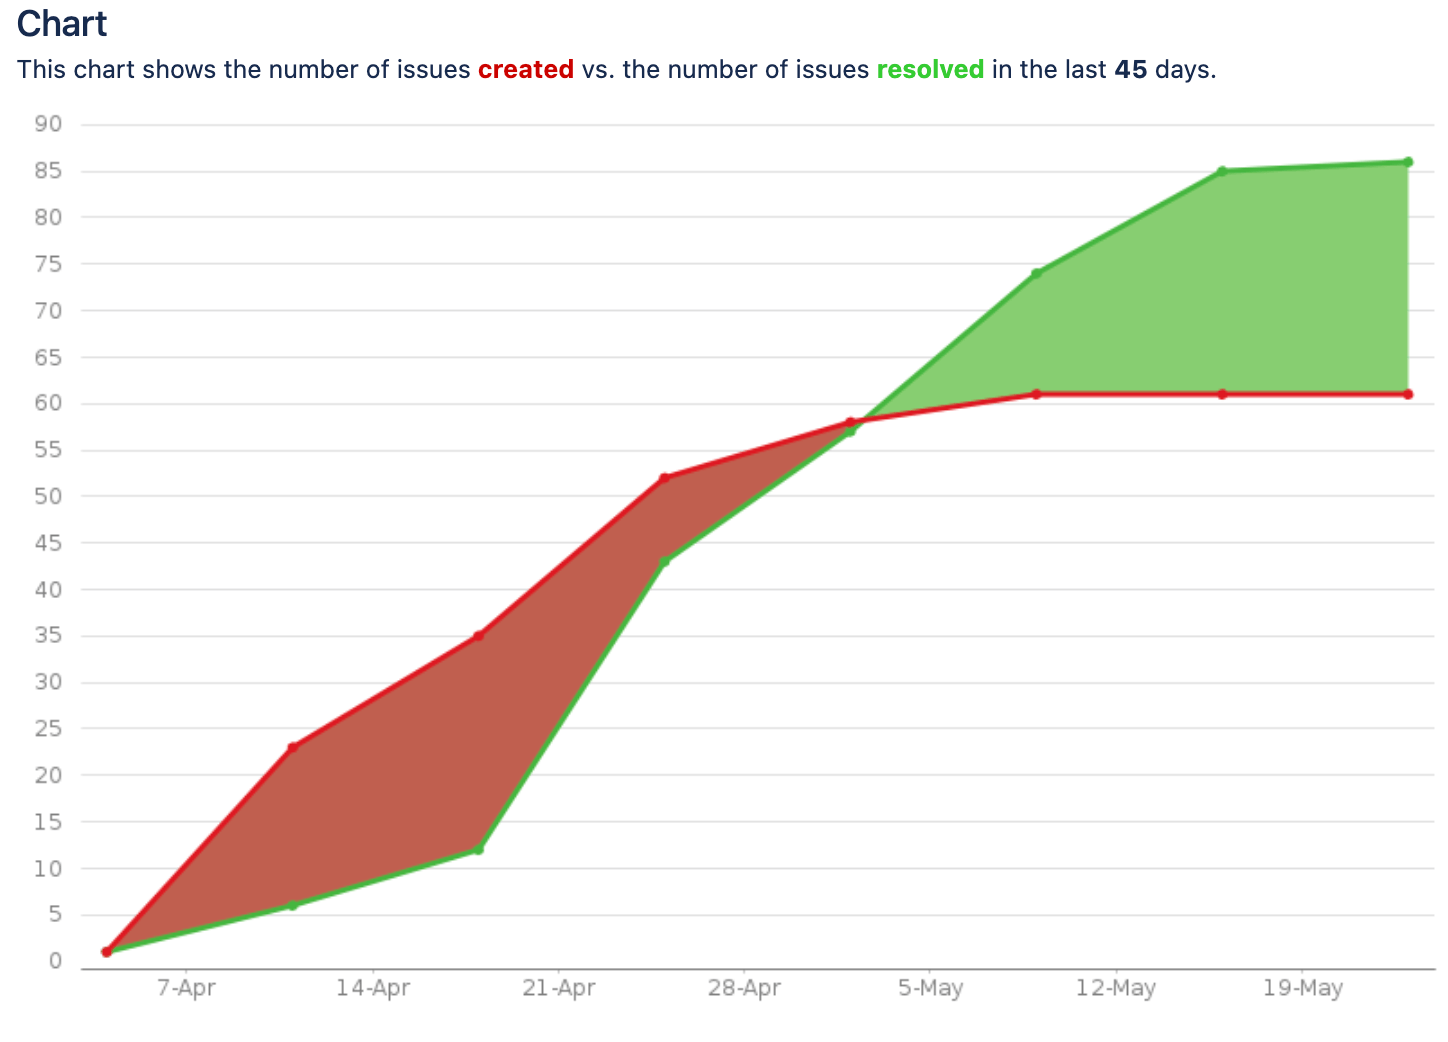
Throughput is easily measured by the built-in Jira report “Created vs. Resolved Issues Report” (Fig. 5). You can set several parameters there, e.g. periods you would like to check (e.g. weekly or monthly) and how many previous days should be checked. The report shows a comparison of created and resolved tasks in measured periods. The number of resolved tasks is your team’s throughput.
Interruptions can be checked by filtering tasks which were moved to the Blocked status (or any other dedicated status) in the last days. A simple filter JQL (Jira Query Language) command for such filtering is as follows:
status changed to (Blocked) by (username1, username2) after -8d ORDER BY assignee DESC, Rank ASC
You can also use the built-in report “Cumulative Flow Diagram,” which shows changes in a metric’s status in a given period of time.
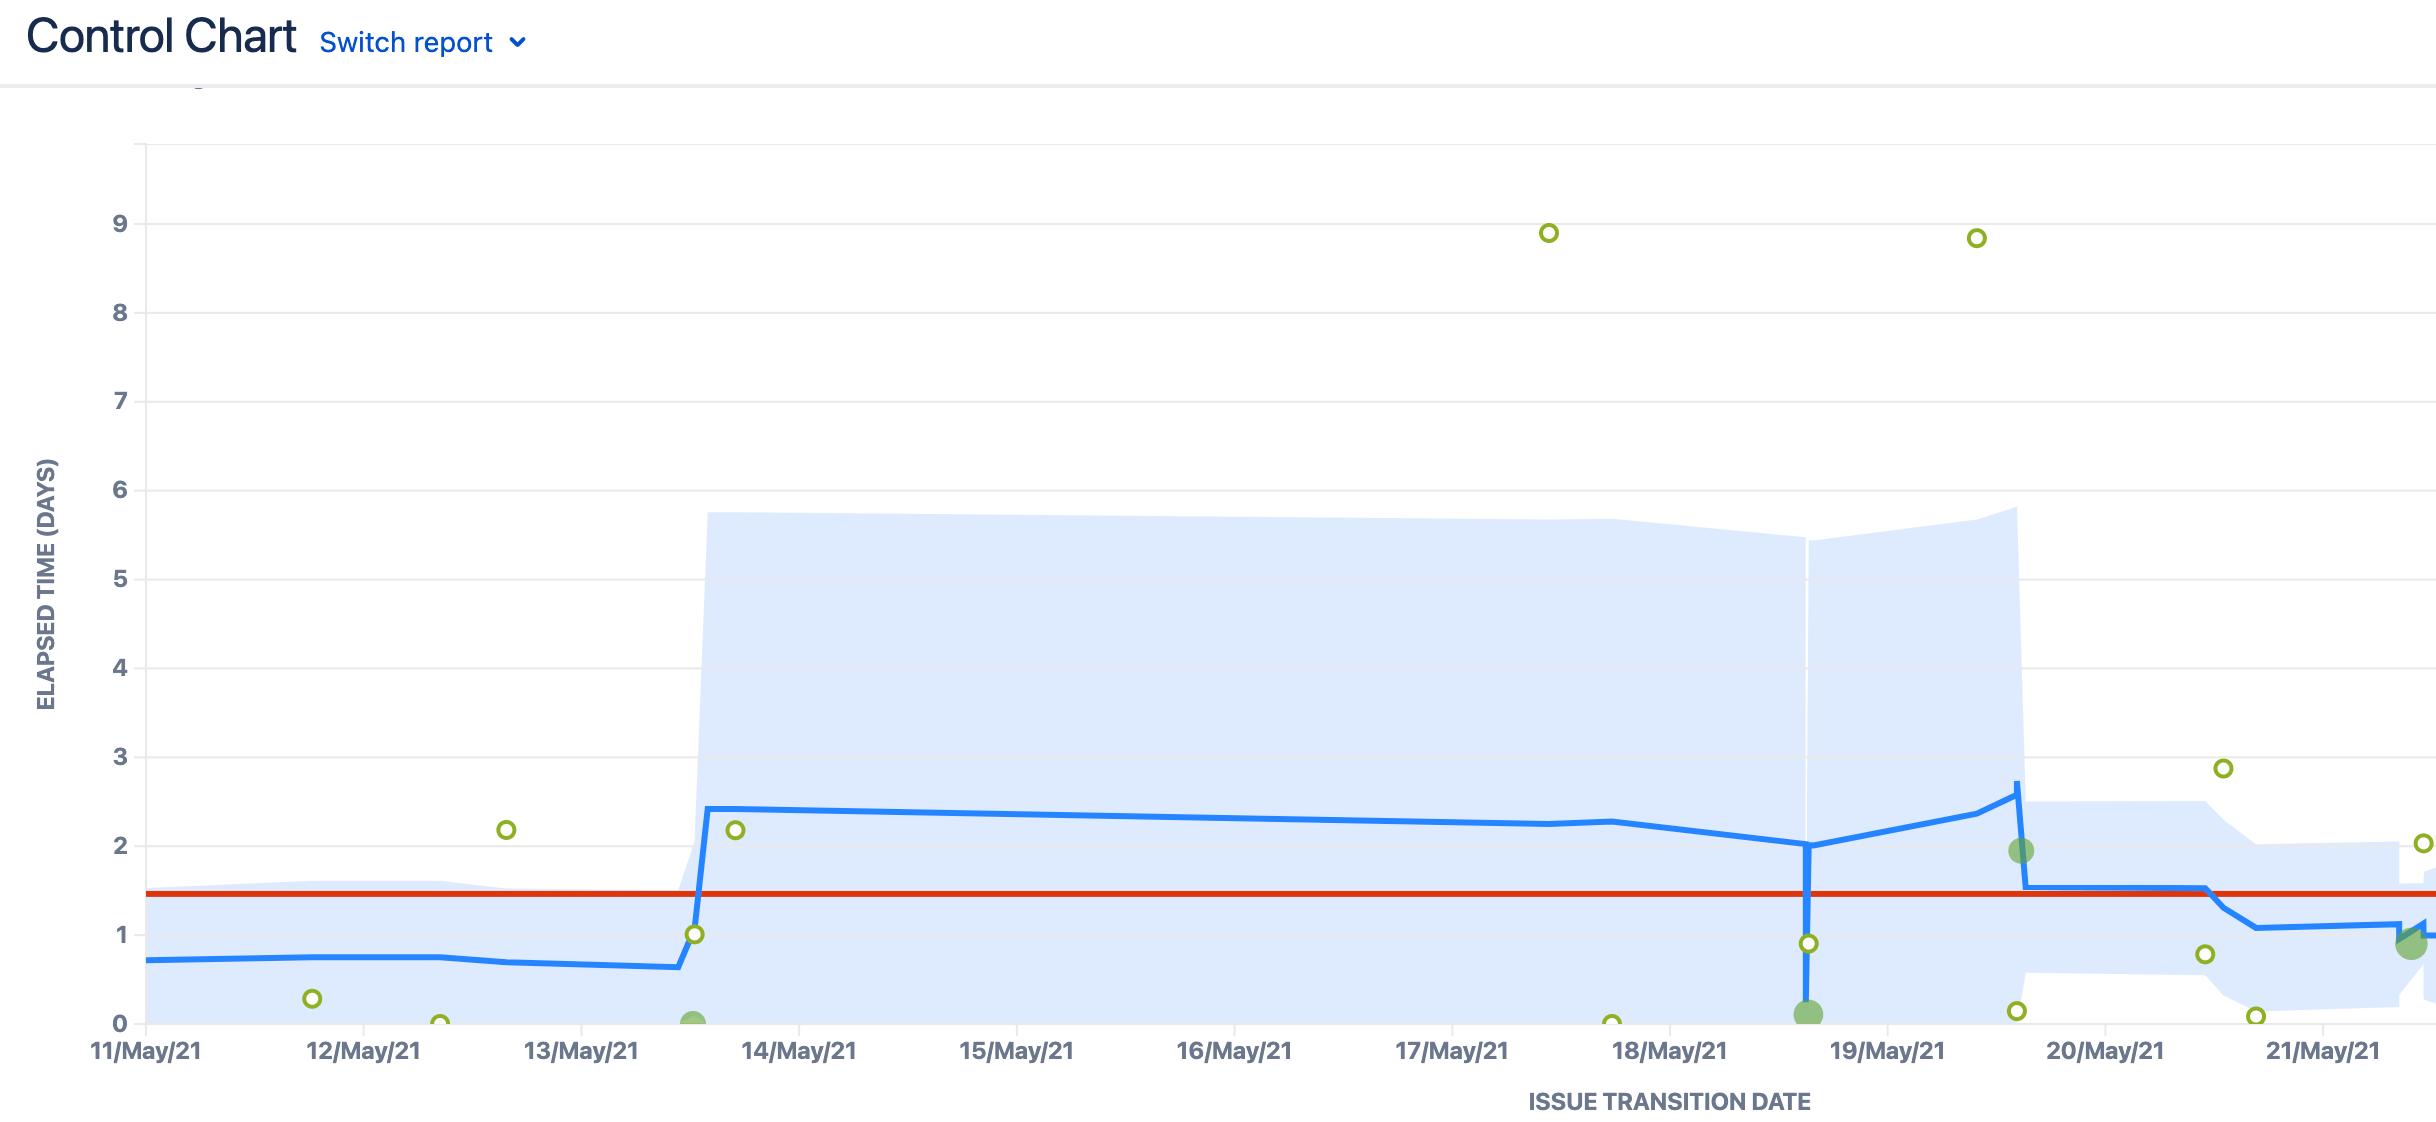
Average Cycle Time is automatically calculated by Jira and presented on another built-in “Control Chart” (Fig. 6). It looks at all finished tasks. Based on this report, you can also easily analyse deviations from the average execution time. Average time is shown as a red line on the chart. Bear in mind that this average value is calculated based on the entire range of data picked up for the chart.
Final thoughts
The three software development metrics I’ve described today are obviously not the only ones you can pick up to measure the progress of your software project. There are a whole bunch of other metrics, like your team’s capacity, number of tasks in backlog, number of defects in a period of time, technical debt, and customer satisfaction. But in our experience, these three are crucial ones in a dynamic startup environment. Other metrics depend on them.
If you:
- Split tasks into smaller chunks properly
- Avoid interruptions
- Work quickly on what you have started
- Observe your throughput
Then:
- Customer satisfaction will increase
- Backlog, technical debt and number of bugs will decrease
- Your team will be better motivated and happier with the work


