When we talk about Python development, understanding the performance characteristics of your applications is crucial for optimization and troubleshooting. py-spy, a powerful sampling profiler, steps in to offer deep insights into Python processes with minimal overhead. Unlike many other profiling tools that might slow down your application, py-spy operates with a negligible performance hit, making it an ideal choice for both development and production environments.
py-spy provides a window into the performance of your Python applications, allowing you to pinpoint bottlenecks, track down performance issues, and understand where your program spends most of its time. This capability is essential for developers aiming to optimize their code, enhance efficiency, and ensure a smooth user experience.
In this article, we will take an in-depth look at py-spy and its capabilities. After reading, you will have a comprehensive understanding of how to leverage py-spy to ‘spy’ on your Python applications, uncover performance issues, and enhance your coding efficiency.
Understanding py-spy
py-spy operates as a sampling profiler, which distinguishes it from traditional tracing profilers. Sampling profilers periodically capture snapshots of the call stack at regular intervals, whereas tracing profilers record every function call and return, which can introduce significant overhead. Here's a detailed look at how py-spy works under the hood:
Step 1: Attaching to Python processes
py-spy can attach to running Python processes without requiring any modifications to the code. It achieves this by interfacing with the operating system's mechanisms for inspecting the state of a running process, including its memory and CPU registers. This allows py-spy to seamlessly monitor and profile Python applications.
Step 2: Reading Python states
Once attached, py-spy reads the internal state of the Python interpreter from the target process's memory. It specifically looks at the Global Interpreter Lock (GIL) and the current thread state. The GIL is a mutex that protects access to Python objects, ensuring that only one thread executes Python bytecode at a time. By inspecting the GIL, py-spy can determine which thread is currently running.
Step 3: Capturing call stacks
At regular intervals (by default, 100 times per second), py-spy samples the call stack of the running Python threads. It does this by traversing the linked list of Python stack frames. Each frame contains information about the function being executed, its arguments, and the file and line number in the source code.
Step 4: Generating profiles
py-spy aggregates these call stack samples over time to build a profile of the application's execution. This profile includes information on which functions are being called, how often they are called, and how much time is spent in each function. The result is a statistical representation of where the application spends most of its time.
Step 5: Visualizing data with flame graphs
One of the most useful outputs of py-spy is the flame graph, a visualization that shows the hierarchical structure of function calls and their relative costs. Each box in the flame graph represents a function, with the width of the box corresponding to the time spent in that function. The vertical stacking of boxes shows the call hierarchy, with deeper stacks indicating deeper levels of function calls.
Handling multiple threads
In applications with multiple threads, py-spy can profile all threads simultaneously. It captures call stack samples from each thread and aggregates them into a unified profile. This allows developers to see how different threads are interacting and identify any thread-specific performance issues.
Technical details and efficiency
- Low overhead: py-spy's sampling approach incurs minimal overhead compared to tracing profilers. Since it only captures snapshots at intervals, the impact on the target application's performance is negligible. Additionally, py-spy can be run in non-blocking mode, ensuring that the target application continues to run smoothly even while being profiled
- No instrumentation required: py-spy does not require any changes to the application's source code or the inclusion of any special libraries. This makes it easy to use in production environments.
- Cross-platform support: py-spy supports multiple platforms, including Linux, macOS, and Windows. It leverages platform-specific APIs to attach to and inspect Python processes.
- Written in Rust: py-spy is written in Rust, a systems programming language known for its performance and safety. Rust's guaranteed memory safety and concurrency features ensure that py-spy can perform efficient, low-overhead profiling without introducing errors or instability into the target application.
For more detailed information, refer to the py-spy home page .
Moreover, if you’re looking for more details about Rust, you can check out our previous article: Rust vs C: safety and performance in low-level network programming.
Installation and setup
Setting up py-spy is straightforward, and it can be installed on multiple platforms including Linux, macOS, and Windows. Here’s a step-by-step guide to get py-spy up and running in your development environment. In this article we will be using the Linux environment.
- Installing py-spy
py-spy can be installed using Python’s package manager, pip. Open your terminal or command prompt and run the following command:
pip install py-spy
This command downloads and installs the latest version of py-spy from the Python Package Index (PyPI). For more installation options, visit the py-spy home page .
- Verifying the installation
After installation, you can verify that py-spy is correctly installed by running:
py-spy --version
This command should output the version of py-spy that you have installed, confirming that the installation was successful.
Exploring py-spy features
py-spy offers three subcommands that allow you to profile your Python applications in different ways: record, top, and dump. You can use py-spy to profile a running Python process by attaching to it, or you can run your Python script directly with py-spy. Here’s how to use these commands:
Using the record subcommand
The record subcommand is used to record profiling data over a specified period of time. This command captures the call stack samples continuously and saves the collected data into a file, typically generating a flame graph that visually represents where the application spends most of its time.
py-spy record -o profile.svg --pid 123
# OR
py-spy record -o profile.svg -- python myprogram.py
Let's create a simple Python script to calculate Fibonacci numbers:
import time


def fibonacci(n: int) -> int:
    if n <= 0:
        return 0
    elif n == 1:
        return 1
    else:
        return fibonacci(n-1) + fibonacci(n-2)


def main() -> None:
    start_time = time.time()
    result = fibonacci(35)
    end_time = time.time()

    print(f"Fibonacci result: {result}")
    print(f"Time taken: {end_time - start_time:.2f} seconds")


if __name__ == "__main__":
    main()
Running this script will generate the following result:
$ python3.11 fibonacci.py
Fibonacci result: 9227465
Time taken: 1.50 seconds
Now, let's profile this script with py-spy:
$ py-spy record -o profile.svg -- python3.11 fibonacci.py
py-spy> Sampling process 100 times a second. Press Control-C to exit.

Fibonacci result: 9227465
Time taken: 1.67 seconds

py-spy> Stopped sampling because process exited
py-spy> Wrote flamegraph data to 'profile.svg'. Samples: 165 Errors: 0
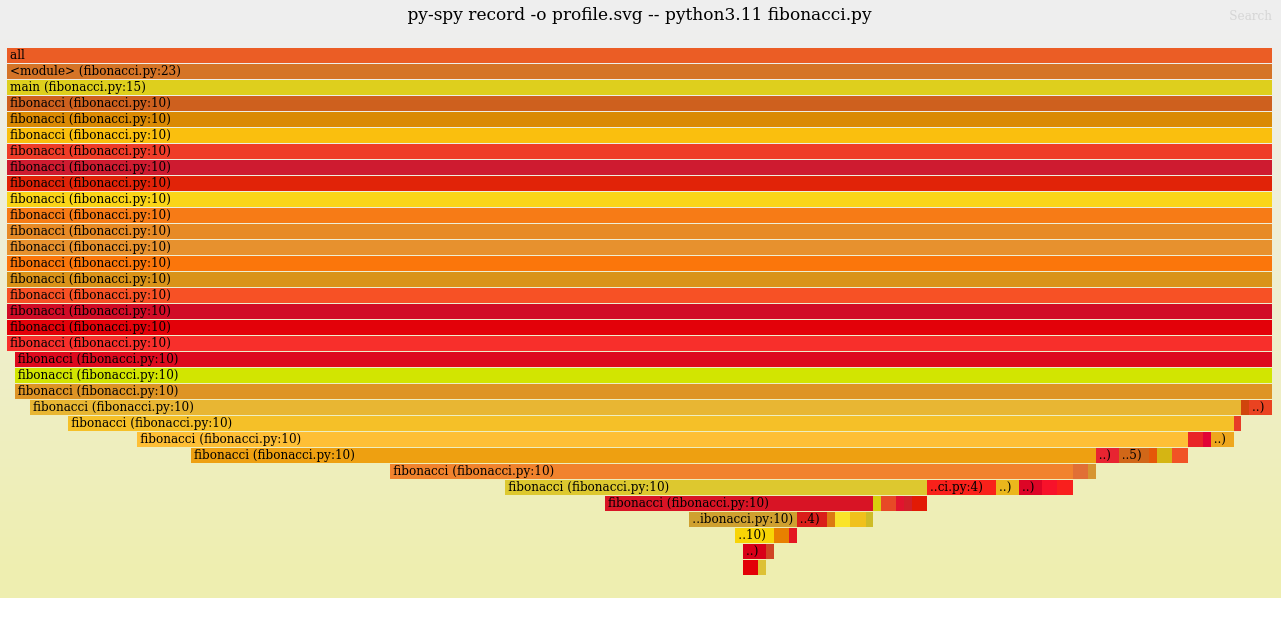
Then, open the profile.svg file (e.g. in a web browser). As expected, you'll see that all the time was spent in the fibonacci function and its recursive calls. You can hover your mouse over the graph to view detailed information about each call stack, such as the file and line number, or the number of samples collected for that stack.
Using the top subcommand
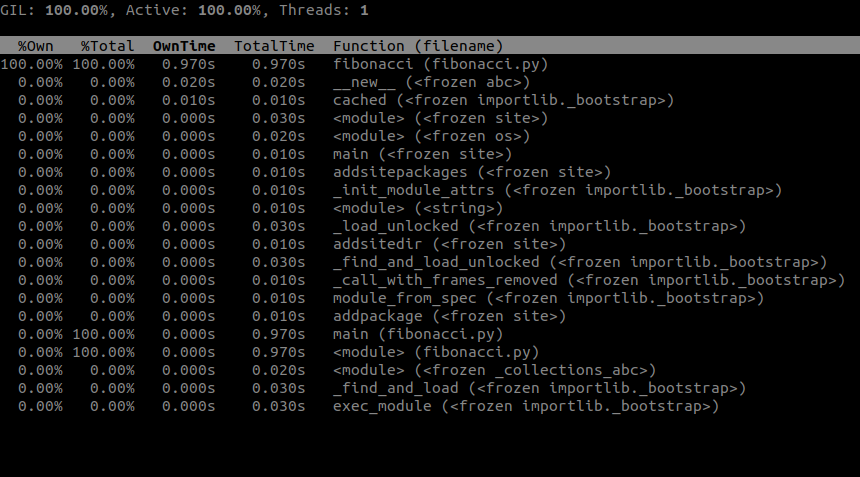
The top subcommand provides a real-time, top-like view of the CPU usage of the different functions in your Python process:
py-spy top --pid <PID>
# OR
py-spy top -- python myprogram.py
Using the example from record, you can run the fibonacci script with the py-spy top command:
py-spy top -- python3.11 fibonacci.py
To see the top-like output in your console:
Using the dump subcommand
The dump subcommand captures a snapshot of the current call stack of each Python thread and can either save it to a file or write it to the console. It is particularly useful for diagnosing why your program is stuck when the cause is not immediately clear:
py-spy dump --pid <PID>
Let's define a more advanced example: in this case, we will spawn five workers in the ThreadPoolExecutor which will calculate the Fibonacci numbers from 1 to 35 (note: this is not the most efficient way to do it in Python; it is used here to demonstrate py-spy's capabilities):
from concurrent.futures import ThreadPoolExecutor


def fibonacci(n: int) -> int:
    if n <= 0:
        return 0
    elif n == 1:
        return 1
    else:
        return fibonacci(n-1) + fibonacci(n-2)


def worker(val: int) -> None:
    print(f"{val}: {fibonacci(val)}")


def main() -> None:
    with ThreadPoolExecutor(max_workers=5) as executor:
        futures = [executor.submit(worker, val) for val in range(1, 36)]
        for future in futures:
            future.result()


if __name__ == "__main__":
    main()
Now, let's run this example and attach py-spy to the process to dump the call stack. Note that in this case, we are attaching to a running process, and reading memory from a different process might not be allowed for security reasons. Therefore, we will run it as the root user:
python3.11 threadpools.py & sleep 0.1 && sudo py-spy dump -p $!
Running this command will start the Python process, sleep for 100ms, and then try to dump the Python call stacks. Example output:
Thread 3053106 (idle): "MainThread"
	wait (threading.py:327)
	result (concurrent/futures/_base.py:451)
	main (threadpools.py:19)
	<module> (threadpools.py:22)
Thread 3053108 (active+gil): "ThreadPoolExecutor-0_0"
	fibonacci (threadpools.py:6)
	fibonacci (threadpools.py:10)
	...
	fibonacci (threadpools.py:10)
	fibonacci (threadpools.py:10)
	worker (threadpools.py:13)
	run (concurrent/futures/thread.py:58)
	_worker (concurrent/futures/thread.py:83)
	run (threading.py:982)
	_bootstrap_inner (threading.py:1045)
	_bootstrap (threading.py:1002)
Thread 3053109 (idle): "ThreadPoolExecutor-0_1"
	worker (threadpools.py:13)
	run (concurrent/futures/thread.py:58)
	_worker (concurrent/futures/thread.py:83)
	run (threading.py:982)
	_bootstrap_inner (threading.py:1045)
	_bootstrap (threading.py:1002)
Thread 3053110 (idle): "ThreadPoolExecutor-0_2"
	worker (threadpools.py:13)
	run (concurrent/futures/thread.py:58)
	_worker (concurrent/futures/thread.py:83)
	run (threading.py:982)
	_bootstrap_inner (threading.py:1045)
	_bootstrap (threading.py:1002)
Thread 3053111 (idle): "ThreadPoolExecutor-0_3"
	fibonacci (threadpools.py:4)
	fibonacci (threadpools.py:10)
	...
	fibonacci (threadpools.py:10)
	fibonacci (threadpools.py:10)
	worker (threadpools.py:13)
	run (concurrent/futures/thread.py:58)
	_worker (concurrent/futures/thread.py:83)
	run (threading.py:982)
	_bootstrap_inner (threading.py:1045)
	_bootstrap (threading.py:1002)
Thread 3053112 (idle): "ThreadPoolExecutor-0_4"
	fibonacci (threadpools.py:4)
	fibonacci (threadpools.py:10)
	...
	fibonacci (threadpools.py:10)
	fibonacci (threadpools.py:10)
	worker (threadpools.py:13)
	run (concurrent/futures/thread.py:58)
	_worker (concurrent/futures/thread.py:83)
	run (threading.py:982)
	_bootstrap_inner (threading.py:1045)
	_bootstrap (threading.py:1002)
The output is quite long, but let’s try to analyze it. First of all, we can clearly see that the MainThread is idle and waiting for other threads to do the work. We have five additional threads created by ThreadPoolExecutor from ThreadPoolExecutor-0_0 to ThreadPoolExecutor-0_4.
- ThreadPoolExecutor-0_0 is active+gil, meaning it is active doing the calculations and holding the Global Interpreter Lock (GIL).
- The other threads are idle, either waiting for the GIL to continue their work or for new tasks from the ThreadPoolExecutor.
Advanced options
Here are some additional options you can use with the subcommands. Use py-spy <subcommand> --help to see which options are applicable to each subcommand:
-
Profiling duration
You can specify how long you want to record the profiling data using the --duration option. This determines the length of time over which py-spy will collect call stack samples.
-
Output file
The profiling data is saved into a specified output file. You can set the output file name using the --output option.
-
Output format
The output file can be saved in one of three file formats: flamegraph (default), raw and speedscope.
- Flamegraph: This format generates an SVG file containing a graph, which visually represents the call stack samples. Flame graphs are useful for quickly identifying which parts of the code consume the most CPU time. It is ideal for visual analysis and identifying performance bottlenecks through an interactive and easy-to-understand graph.
- Raw: The raw format saves the profiling data in a binary format that contains detailed information about the call stack samples. This format is useful for post-processing or analysis with other tools. Suitable for advanced users who need to perform custom analyses or integrate with other profiling tools that can parse raw data.
- Speedscope: The speedscope format generates a JSON file that can be loaded into the Speedscope
profiler, a web-based tool for interactive visualization of profiling data. Speedscope provides advanced features for exploring and analyzing the performance of your application.
-
Rate of sampling
The rate of sampling refers to how frequently the profiler captures snapshots of the call stack during the execution of a Python application. This rate is measured in samples per second and is a crucial parameter for controlling the level of detail and accuracy of the profiling data. By default, py-spy samples the call stack 100 times per second. This default rate provides a good balance between capturing sufficient detail for accurate profiling and minimizing the overhead introduced by the profiler. You can adjust the sampling rate using the --rate option. The appropriate sampling rate depends on the specific requirements of your profiling task:
- Short Duration, High Precision: For short-running scripts or when detailed profiling is necessary, a higher sampling rate may be beneficial to capture detailed performance data.
- Long Duration, Low Overhead: For long-running applications or in production environments where minimal impact is essential, a lower sampling rate can be more appropriate.
-
Additional options
py-spy offers several additional options to provide more control and flexibility during profiling. These options allow you to handle subprocesses, capture native stack traces, or run py-spy in non-blocking mode:
- Profile subprocesses: This option allows py-spy to profile not just the main Python process but also any subprocesses that it spawns. This is particularly useful for applications that use multiprocessing. To profile subprocesses, add the --subprocesses option to your command.
- Profiling native extensions: To profile native extensions, use the --native option in your command. Enabling this option allows py-spy to capture native stack traces alongside Python stack traces. This is particularly useful for diagnosing issues involving native extensions or C libraries used by Python. It is beneficial for applications that heavily utilize native code, such as those employing C extensions, Cython, or performance-critical libraries like NumPy and pandas. For more detailed guidance, refer to this informative blog post
by Ben Frederickson.
- Run in non-blocking mode: To profile in non-blocking mode, add the --nonblocking option to your command. This ensures that the target Python process is not paused during profiling, preventing any interruptions to the program. However, this mode may increase the likelihood of errors during sampling, as reading the process memory is not atomic and requires multiple calls to obtain the stack trace.
Using py-spy for optimization
Let's create a more complex example and then use py-spy to optimize it. We will create a script for asynchronous monitoring aimed at checking the health status of external services. As with any monitoring tool, it runs an infinite loop that executes various checks every five seconds using the asyncssh Python library. Here's a simple, though not perfect, implementation:
import asyncio
import asyncssh
import time

# Global commands to be run on all endpoints
COMMANDS = [
    "uptime",                     # Monitor Uptime
    "top -bn1 | grep 'Cpu(s)'",   # Monitor CPU usage
    "free -m",                    # Monitor memory usage
    "df -h",                      # Monitor disk usage
]

# List of external IP addresses and SSH details
TARGETS = [
    {
        "ip": "172.18.3.2",
        "port": 22,
        "user": "test",
        "password": "test"
    },
    {
        "ip": "172.18.3.3",
        "port": 22,
        "user": "test",
        "password": "test"
    }
]


async def run_ssh_command(ip: str, port: int, user: str, password: str, command: str) -> None:
    # Connect to the remote server
    async with asyncssh.connect(ip, port=port, username=user, password=password) as conn:
        # Run the SSH command
        await conn.run(command)


async def monitor(ip: str, port: int, user: str, password: str) -> None:
    print(f"monitoring {ip}")
    tasks = [run_ssh_command(ip, port, user, password, command) for command in COMMANDS]
    await asyncio.gather(*tasks)
    print(f"finished monitoring {ip}")


async def main() -> None:
    while True:
        start = time.perf_counter()
        tasks = [monitor(target["ip"], target["port"], target["user"], target["password"]) for target in TARGETS]
        await asyncio.gather(*tasks)

        print(f"finished monitoring loop in {time.perf_counter() - start}")
        # Wait for 5 seconds before the next iteration
        await asyncio.sleep(5)


if __name__ == "__main__":
    asyncio.run(main())
Running this script will perform the monitoring tasks correctly. In this example, we are not concerned with the results of the monitoring but rather with how the process works under the hood, so the results are ignored. Let's now attach py-spy to this process and see what it reveals. We'll use speedscope for visualization:
py-spy record -p 1670524 --duration 10 -F -t -f speedscope -o profile_monitoring
py-spy> Sampling process 100 times a second for 10 seconds. Press Control-C to exit.

py-spy> Wrote speedscope file to 'profile_monitoring'. Samples: 154 Errors: 0
py-spy> Visit https://www.speedscope.app/ to view
After loading the output file in speedscope , you can see a beautiful and interactive representation of the profile. The interface allows you to change the display mode, categorize functions, and select specific functions to read more details about them. This visualization helps you understand the performance characteristics and bottlenecks of your asynchronous monitoring script:
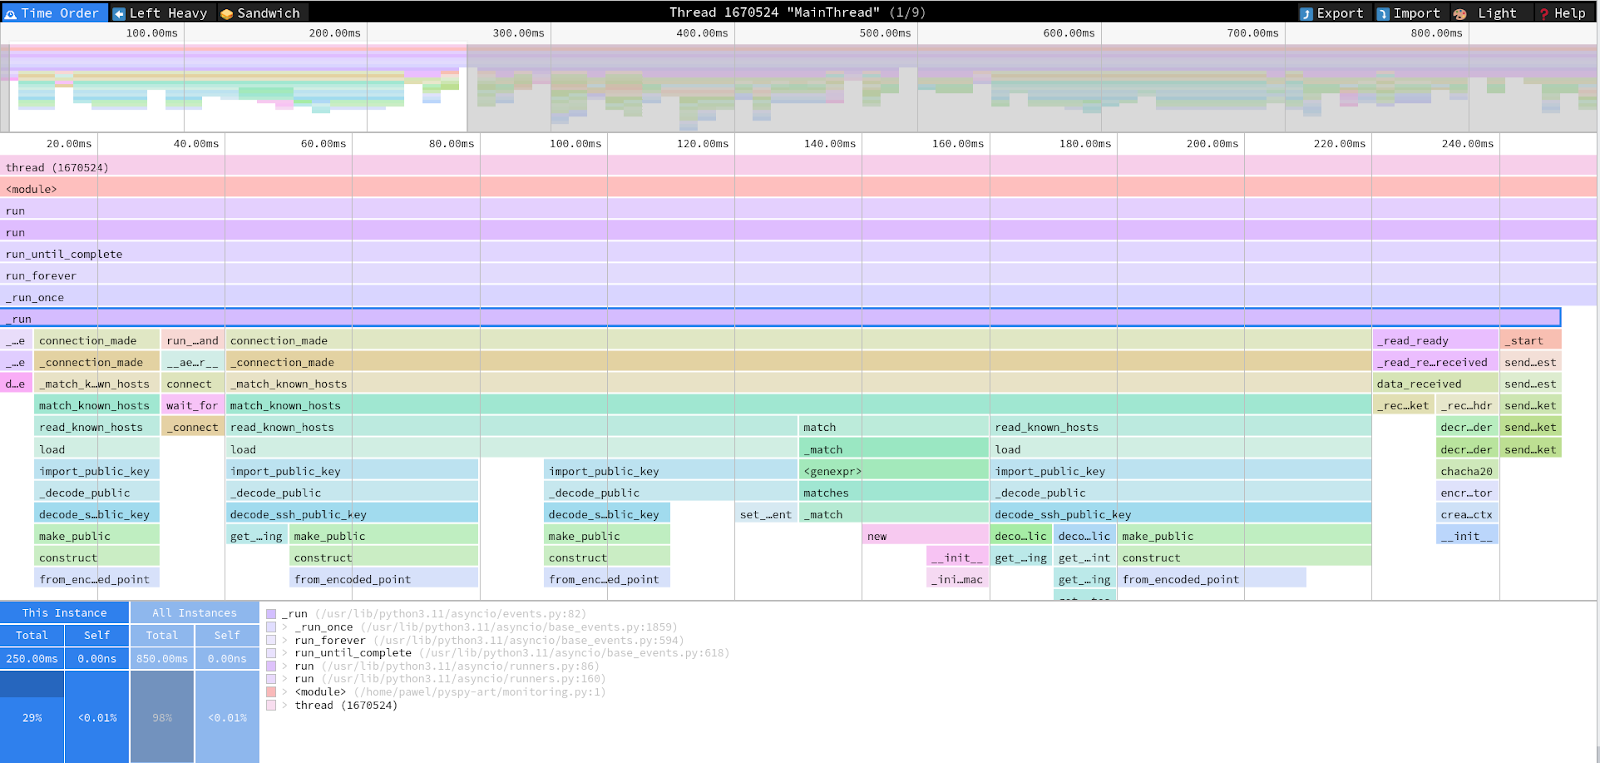
Now, we can examine whether our monitoring implementation has any bottlenecks. The output indicates that each iteration takes around 700ms.
...
finished monitoring loop in 0.7552127689996269
...
finished monitoring loop in 0.627268437994644
...
finished monitoring loop in 0.7255614750029054
Let's start by identifying where most of the time is being spent. To do this, we can use the "Sandwich" mode in the Speedscope app. By sorting the results by "Self" time, we can see which parts of the monitoring process are consuming the most time:
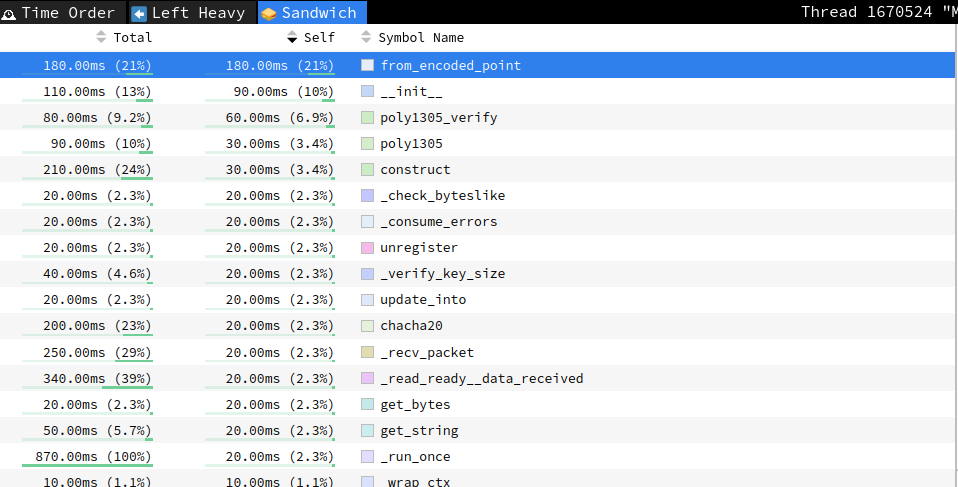
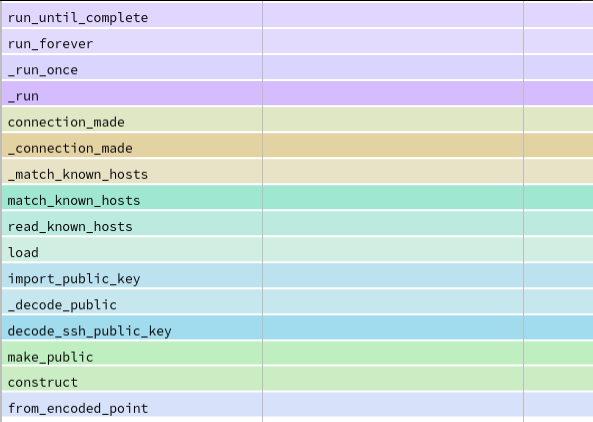
After inspection, we can see that the top two functions are related to creating SSH connections to the endpoints, which consume a significant amount of resources. For example, the from_encoded_point function is part of the connection_made function from asyncssh.connect:
We can certainly optimize the code to avoid creating a new SSH connection for every command. Instead, we can create a single connection and reuse it for all commands. Here's the updated code:
...
async def run_ssh_command(conn, command):
    return await conn.run(command)


async def monitor(ip: str, port: int, user: str, password: str):
    # Connect to the remote server
    async with asyncssh.connect(ip, port=port, username=user, password=password) as conn:
        print(f"monitoring {ip}")
        tasks = [run_ssh_command(conn, command) for command in COMMANDS]
        await asyncio.gather(*tasks)
        print(f"finished monitoring {ip}")
...
After these changes, the code establishes a single SSH connection for each target and reuses it to run all the commands. Running the monitoring script again, we can observe a significant improvement in the monitoring times, now around 500ms each:
finished monitoring loop in 0.4844069969985867
...
finished monitoring loop in 0.5075201820000075
...
finished monitoring loop in 0.44813751699985005
Let's use py-spy again to check what the profile looks like now:
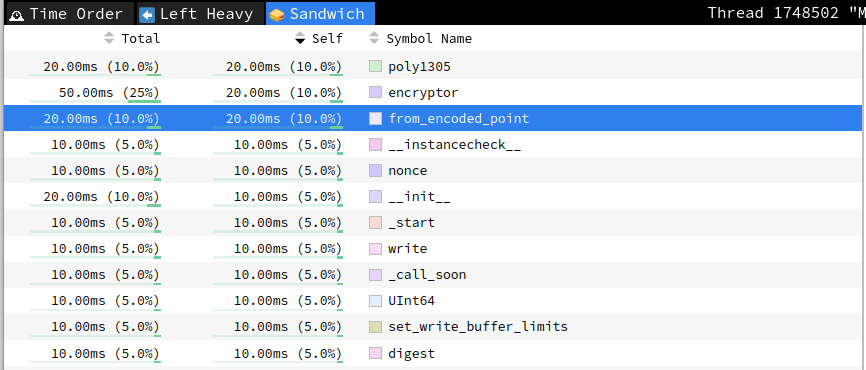
We can still see "from_encoded_point" in the profile, but the time spent there has decreased from 180ms to only 20ms. To further optimize, we can create a connection pool class that will manage these connections, creating them only when necessary. Here's an improved version of the script with a connection pool to optimize SSH connection management:
import asyncio
import asyncssh
import time

# Global commands to be run on all endpoints
COMMANDS = [
    "uptime",                     # Monitor Uptime
    "top -bn1 | grep 'Cpu(s)'",   # Monitor CPU usage
    "free -m",                    # Monitor memory usage
    "df -h",                      # Monitor disk usage
]

# List of external IP addresses and SSH details
TARGETS = [
    {
        "ip": "172.18.3.2",
        "port": 22,
        "user": "test",
        "password": "test"
    },
    {
        "ip": "172.18.3.3",
        "port": 22,
        "user": "test",
        "password": "test"
    }
]


class SSHConnectionPool:
    def __init__(self):
        self.connections = {}

    async def get_connection(self, ip, port, user, password):
        if ip not in self.connections:
            self.connections[ip] = await asyncssh.connect(ip, port=port, username=user, password=password)
        return self.connections[ip]

    async def run_ssh_command(self, conn, command):
        return await conn.run(command)


async def run_ssh_command(conn, command):
    return await conn.run(command)


async def monitor(pool, ip, port, user, password):
    conn = await pool.get_connection(ip, port, user, password)
    print(f"monitoring {ip}")
    tasks = [pool.run_ssh_command(conn, command) for command in COMMANDS]
    await asyncio.gather(*tasks)
    print(f"finished monitoring {ip}")


async def main():
    pool = SSHConnectionPool()
    while True:
        start = time.perf_counter()
        tasks = [monitor(pool, target["ip"], target["port"], target["user"], target["password"]) for target in TARGETS]
        await asyncio.gather(*tasks)
        print(f"finished monitoring loop in {time.perf_counter() - start}")
        await asyncio.sleep(5)


if __name__ == "__main__":
    asyncio.run(main())
Now, the first loop takes around 450ms, but subsequent loops take less than 300ms:
...
finished monitoring loop in 0.4519332299969392
...
finished monitoring loop in 0.2603657460131217
...
finished monitoring loop in 0.2710438189969864
And there are no more connection-related function calls in the profile:
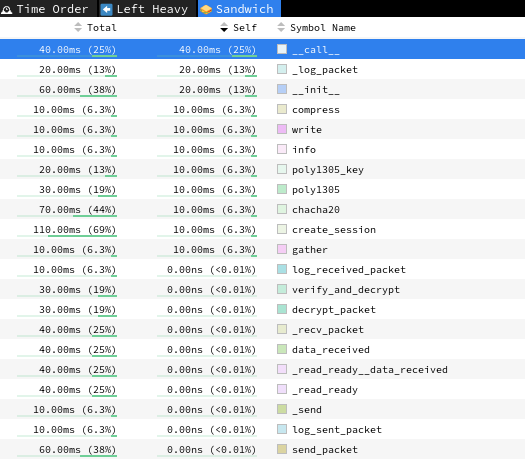
This indicates that our optimization by using a connection pool has significantly reduced the overhead associated with establishing SSH connections. While our monitoring app has improved, it is still far from perfect: we need to implement better error handling and timeouts. The optimization process was straightforward in our case, but py-spy can be used to profile much more advanced applications.
Conclusions
The best approach to optimization is to first measure your application's performance, identify where most of the time is being spent, apply optimizations, and then verify the improvements. py-spy makes this process super easy by providing precise profiling data that helps you pinpoint performance bottlenecks quickly and accurately, making it an essential tool for developers aiming to optimize their code's performance. Its ability to provide detailed insights into where your application spends most of its time, with minimal overhead, sets it apart from other profilers. These characteristics make py-spy suitable for a wide range of Python projects, from small scripts to large-scale applications running in production environments.
Advantages of py-spy:
- Simplicity and ease of use: py-spy can be installed and used with minimal setup, allowing developers to quickly start profiling their applications without making any code modifications.
- Minimal overhead: The sampling-based approach ensures that the impact on application performance is negligible, enabling py-spy to be used in production without significant performance degradation.
- Versatility: Whether you are working on a small script or a complex, multi-threaded application, py-spy can handle various scenarios, including profiling subprocesses and capturing native stack traces.
Disadvantages of py-spy:
- No memory profiling: py-spy is designed specifically for CPU profiling and does not track memory allocation and deallocation. This limitation means it cannot be used to diagnose memory leaks or optimize memory usage. Developers needing to analyze memory performance will need to use additional memory profiling tools to complement py-spy.
- Limited to Python: py-spy is designed specifically for Python applications, which means it cannot be used for profiling other languages or mixed-language applications without native extensions.
Despite these limitations, py-spy's strengths in CPU profiling make it an invaluable tool for Python developers. By integrating py-spy into your development workflow, you can gain deeper insights into your application's performance, identify bottlenecks, and implement targeted optimizations.
We encourage readers to explore py-spy further, experiment with its various features, and leverage its capabilities to enhance the performance of their Python projects. Whether you are developing a small utility script or a large-scale web application, py-spy provides the necessary tools to profile and optimize your code efficiently.


