


It is probably the cloud that first comes to mind when you think about the architecture of modern services. It is an obvious choice for building large, distributed systems from scratch, as well as for the many enterprises migrating their infrastructure and services to the cloud. It is all very appealing, and modern, and intelligent. But that does not mean there are not serious challenges in going cloud. How should the infrastructure in use be tested? How can network performance be measured reliably in a cloud environment? Our R&D team decided to modify existing TRex solution a little in a way that pps, latency, jitter and reordering can be measured between separated nodes. Read on to learn more about what we have discovered.
Testing tool for network traffic
To test a network connection, a significant amount of traffic must be created, transmitted through the System Under Test (SUT) and analyzed on the other end. This has traditionally been achieved with a single testing device acting as both transmitter and receiver. This device would be called a packet generator, but would act as both generator and analyzer—at the same time and in the same “box” (see Figure 1).
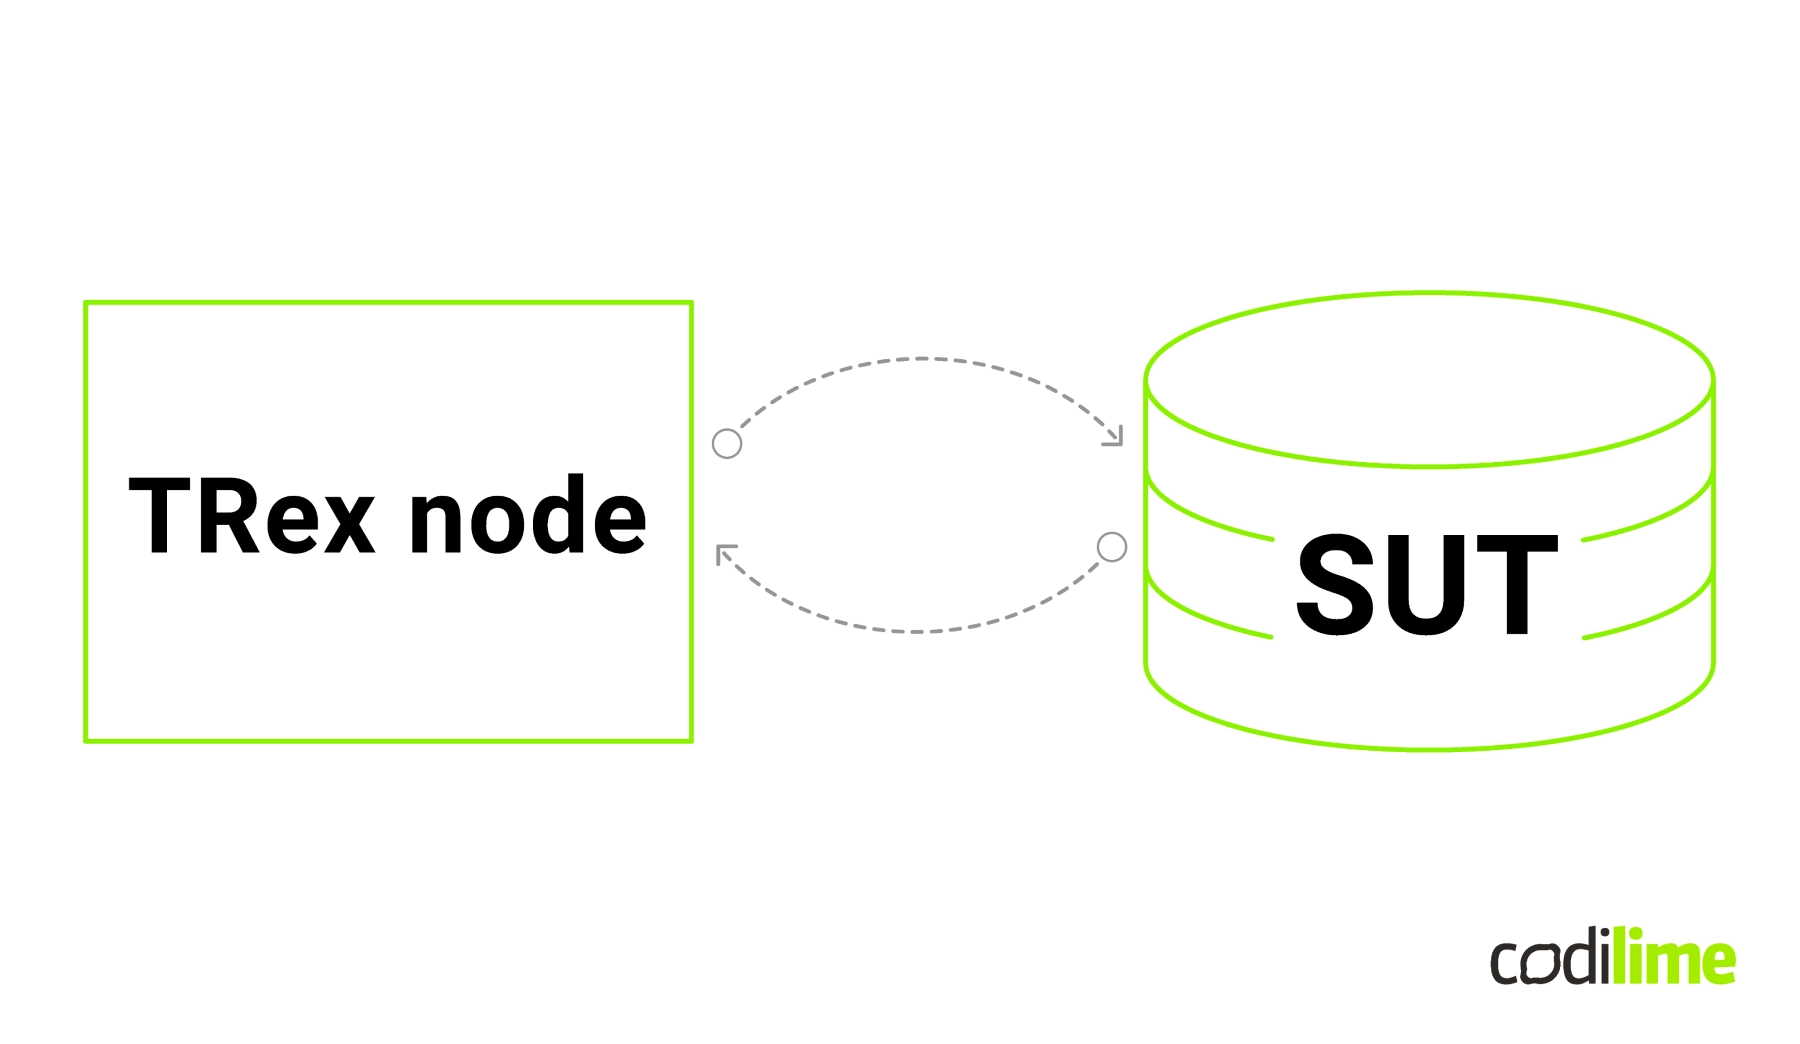
Such a setup can measure the four parameters network engineers are most concerned about: pps, latency, jitter and reordering.
All right, so since you are into network testing appliances, there are two kinds of network testing appliances to choose from: hardware boxes containing proprietary software running on carefully crafted hardware (for example Ixia’s IxNetwork, Xena’s Valkyrie, Spirent TestCenter etc.) and software tools running on generic hardware. There are many good reasons to go with the hardware solution. These boxes usually follow the Unix principle: “do one thing and do it well”. Moreover, they are fine-tuned to do the job and are very reliable, so no surprise their producers have a well-established reputation as skilled and trustworthy. Yet, there is one thorny issue: such hardware is prohibitively expensive. Fortunately, there is a second option: generic hardware running network traffic generator software. It is this solution that our R&D Team has investigated.

A viable solution—TRex
We chose TRex ![]() , a traffic generator originally developed at Cisco and published as an open-source project a few years ago. You will find the detailed reasons we chose TRex in our packet generators comparison. Foremost among them, you can be sure, is its high performance. So effectively does it generate network traffic, in fact, that our office’s uplink was once flooded, prompting us to cut it off from the Internet for a few minutes. And that happened with only one TRex instance and a laptop! Something else to admire about TRex is the support its authors and developers provide. It is a genuine pleasure to work on a project which has such a supportive and welcoming community (thanks Hanoh and Elad!).
, a traffic generator originally developed at Cisco and published as an open-source project a few years ago. You will find the detailed reasons we chose TRex in our packet generators comparison. Foremost among them, you can be sure, is its high performance. So effectively does it generate network traffic, in fact, that our office’s uplink was once flooded, prompting us to cut it off from the Internet for a few minutes. And that happened with only one TRex instance and a laptop! Something else to admire about TRex is the support its authors and developers provide. It is a genuine pleasure to work on a project which has such a supportive and welcoming community (thanks Hanoh and Elad!).
It is also worth mentioning that when we were working on extending TRex, we came across a midway solution between hardware and software. An FPGA SmartNIC made by Napatech supports TRex up to a 100-Gbps line rate. It offers better hardware optimization and thus better parameters than solutions based on generic network interface controllers. Still, it is not free of charge and modifiable, which is another reason we stuck with TRex.
Problem with measuring latency
TRex is definitely one of the best on-premises (usually labs) traffic generators. Unfortunately, it lacks the support for precise latency measurement in distributed environments. Network latency is measured by transmitting a timestamped packet and comparing the timestamp with the one obtained upon packet reception. The process is described in RFC 2544 ![]() (see Figure 2).
(see Figure 2).
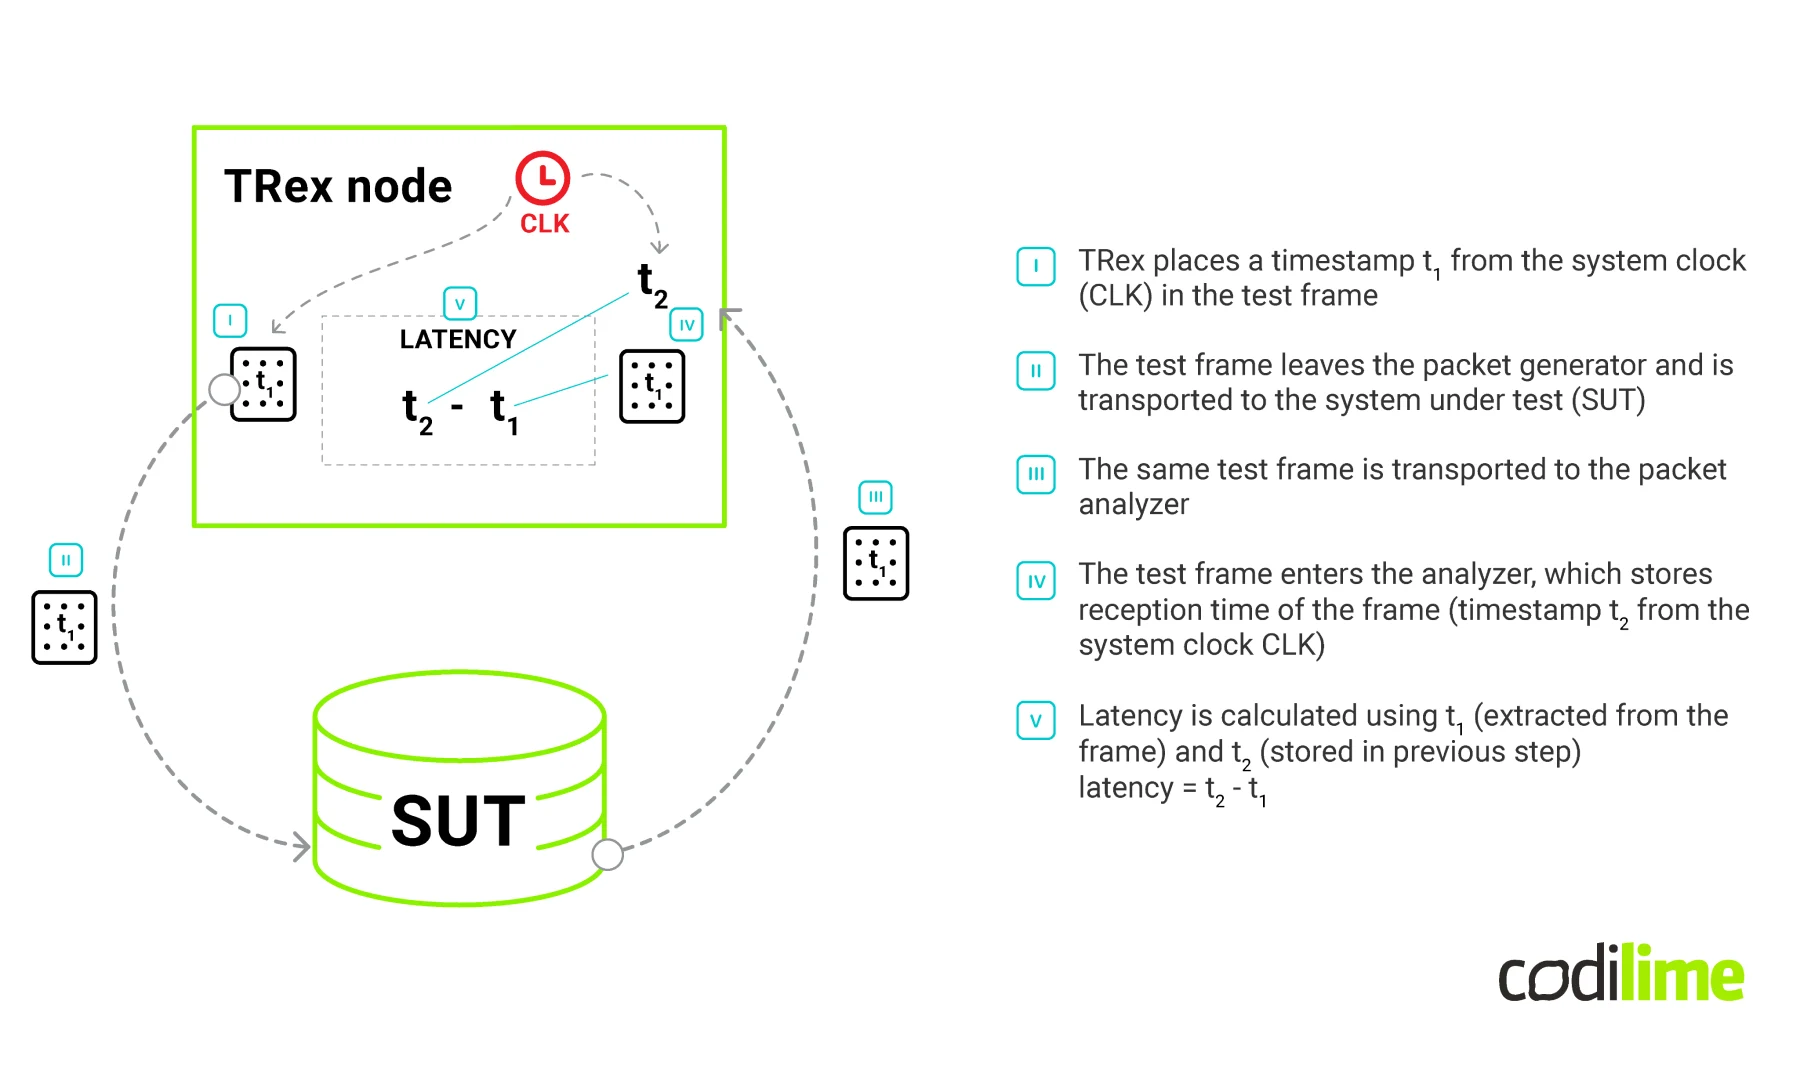
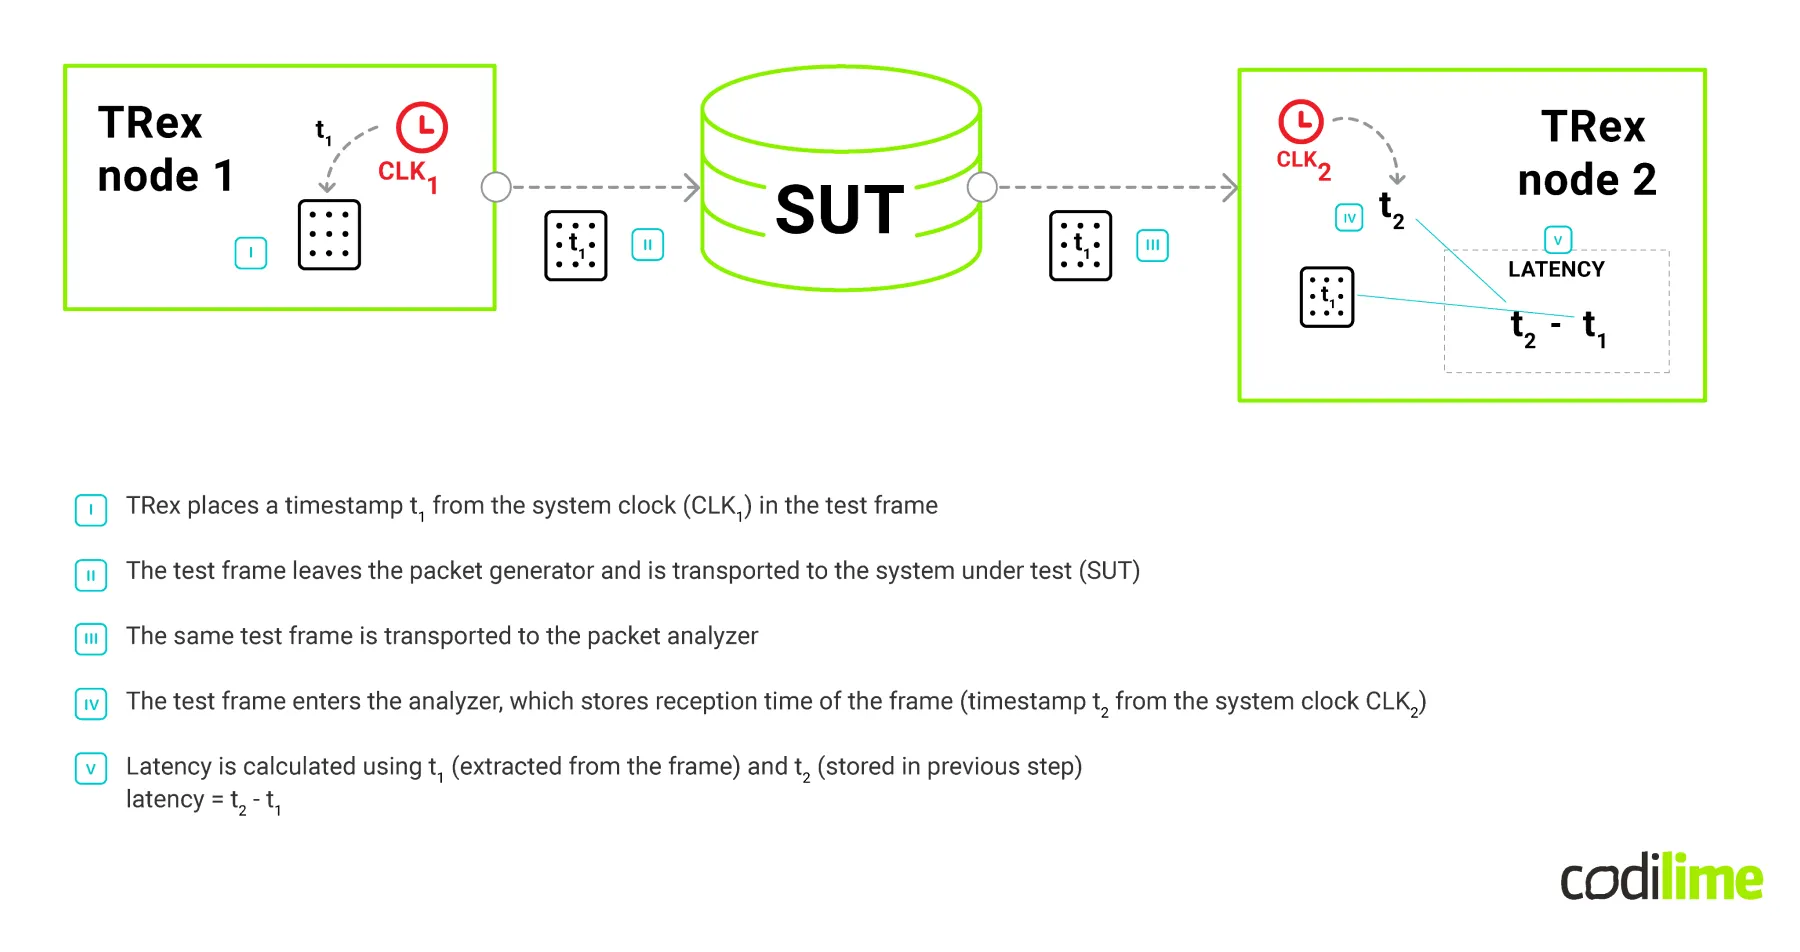
This method of measuring latency works perfectly in a “loopback scenario”, where the transmitting part and receiving part use the same clock source. Yet, testing a single route between distributed entities requires a traffic generator to be split into two parts: transmitting and receiving. This step also introduces a very serious issue—clock synchronisation. Since the mechanism of determining network latency is based on a simple calculation of the difference between two timestamps, it is not possible to determine what part of the calculated value results from the network characteristics and what part results from the difference between the clocks operating on two servers. In order to overcome this difficulty, the difference in indications of both clocks should be eliminated to the greatest extent possible. Both should indicate possibly the same time (see Figure 3).
Aiming at more precise clocks
Currently, there is a state-of-the-art solution delivering sub-microsecond precision. It is based on a GPS receiver connected to the server in use. However, this is not a viable solution for cloud-based machines, since we cannot rely on the actual hardware being used by cloud-service providers. So we are left with the two other most popular mechanisms for clock synchronization: Network Time Protocol (RFC 5905 ![]() ) and Precision Time Protocol (IEEE 1588
) and Precision Time Protocol (IEEE 1588 ![]() ). Network Time Protocol (or NTP) is a very mature, robust protocol dating back to 1985. It is widely adopted all over the Internet. There are many server and client implementations. The protocol is considered to have an accuracy
). Network Time Protocol (or NTP) is a very mature, robust protocol dating back to 1985. It is widely adopted all over the Internet. There are many server and client implementations. The protocol is considered to have an accuracy ![]() of up to several tens of milliseconds for an intercontinental Internet path and sub-milliseconds in local area networks.
of up to several tens of milliseconds for an intercontinental Internet path and sub-milliseconds in local area networks.
It is possible to make these numbers even better. IEEE defined a Standard for a Precision Clock Synchronization Protocol for Networked Measurement and Control Systems (or PTP) which achieves clock accuracy in the sub-microsecond range in local area networks. Furthermore, as PTP is actually supported by some hardware (like NICs and switches), its accuracy might be even better, reaching a precision of tens of nanoseconds. So during the last few months we changed our default TRex method of timestamping latency packets, implemented PTP and wrote testing scripts/scenarios.
TRex modifications
Vanilla TRex software works in a loopback, which means all traffic which originates in it has to go through SUT and back to the TRex generator. This way a single “testing box” can count lost packets, calculate latency, etc. However, it can be problematic—links are not always symmetrical (which can cause latency math to be improper), or it can be hard to prepare such a loopback configuration (particularly in the cloud environment).
This led us to make more TRex instances work together: one (or more) which generates traffic and one which gathers it and does all the calculations. In order to make it work, we crafted a test director—a piece of software that orchestrates the tests (we usually run it on our laptops, but it can be started from any other machine that has access to TRex instances). We then split a single “testing box” into two parts: transmitting and receiving. As a result, a single TRex RX instance and one or more TRex TX instances work together in this “linear” testing environment, all orchestrated by the test director. In order to minimize the impact of control traffic on the test traffic, all communication between TRex instances and the test director uses a different network interface. Once all TRex instances are launched, they listen to the director's commands and return detailed statistics on TRex and traffic parameters.
Next we modified the timestamping method used in latency measurements. By default TRex uses high resolution “ticks” (cycles from the boot) as timestamps. These come either from DPDK driver or OS kernel API. Unfortunately, this approach is unreliable and “unsynchronizable” for multiple instances setups and cannot work with more than one TRex node. So we implemented a different method for obtaining timestamps ![]() , which uses a real-time clock (again either from DPDK or OS kernel) with nanosecond accuracy.
, which uses a real-time clock (again either from DPDK or OS kernel) with nanosecond accuracy.
Since we started using a stable and reliable clock source, we could implement a PTP mechanism for synchronizing time between both TRex instances ![]() . We figured out that in many possible testing environment layouts, the most common scenario would be to have a single receiving and one or more transmitting TRex instances. So a TRex receiving node seems to be a natural fit for a PTP master. And so we carried out our research guided by this assumption. In order to make a PTP implementation versatile
. We figured out that in many possible testing environment layouts, the most common scenario would be to have a single receiving and one or more transmitting TRex instances. So a TRex receiving node seems to be a natural fit for a PTP master. And so we carried out our research guided by this assumption. In order to make a PTP implementation versatile ![]() (and thus usable both in on-premise and cloud-based environments), we implemented both Ethernet (L2) and UDP/IP transport layers. For the latter, we modified a default destination IP address replacing standard multicast addresses with those of other TRex instances. That way we ensure multi-network routability, which is not what PTP authors originally intended, but we wanted to test and provide some measurements.
(and thus usable both in on-premise and cloud-based environments), we implemented both Ethernet (L2) and UDP/IP transport layers. For the latter, we modified a default destination IP address replacing standard multicast addresses with those of other TRex instances. That way we ensure multi-network routability, which is not what PTP authors originally intended, but we wanted to test and provide some measurements.
Below you will find charts with the results of our measurements. To understand their content better, first read through this brief explanation of terms used.
- 2k/1M/10M pps—number of packets per second in the test stream
- 64B / 1400B packets—size of a single Ethernet frame transmitted
- PTP—test conducted with a PTP time synchronization enabled
- NTP (chrony)—test conducted with PTP disabled, only GCP's NTP functionality used to synchronize clocks using chrony application
- callbacks—software-based mechanism that may improve PTP accuracy if NIC does not fully support PTP
- Ping reference is calculated by dividing a round trip time (RTT) reported by ping command by two
The charts illustrating PTP measurements can be found below.
![Latency [ms] in the GCP on public IPs (Internet)](/img/codilime_latency-ms-in-the-gcp-on-public-ips-internet.png)
![Latency [ms] in iternal GCP network](/img/codilime_latency-ms-in-iternal-gcp-network-1-1-1-1.png)
![Latency [ms] in the GCP on public IPs (Internet)](/img/codilime_latency-ms-in-the-gcp-on-public-ips-internet-1-1-1-1-1.png)
![Latency [ms] in internal GCP network](/img/codilime_latency-ms-in-internal-gcp-network-2-1-1-1.png)
Into the battle with our modifications
We started testing our modifications in a Docker-based environment. We had two TRex instances (TX and RX) and a test director which prepared and supervised the tests and reported the results. That of course did not make much sense in terms of time synchronisation (all instances used the same system clock).
The second setup tested was two barebone servers with Intel X520 NICs. We were able to play with various modes of operation ![]() that TRex supports and found out, to our delight, that there were many. Some combination of TRex settings did not allow for time synchronization to happen at all, as PTP packets were handled by hardware. Still, we were able to find other combinations that worked. (During the process we also found a bug in the DPDK documentation and implementation.) We then used this environment to test a hypothetical device/system under test. We placed another machine between two TRex instances and were able to simulate a network appliance.
that TRex supports and found out, to our delight, that there were many. Some combination of TRex settings did not allow for time synchronization to happen at all, as PTP packets were handled by hardware. Still, we were able to find other combinations that worked. (During the process we also found a bug in the DPDK documentation and implementation.) We then used this environment to test a hypothetical device/system under test. We placed another machine between two TRex instances and were able to simulate a network appliance.
Finally, we implemented our solution in Google Cloud Platform. We used two c2-standard-4 (4 vCPUs, 16 GB memory) VM instances in two distant regions: us-central1 (Council Bluffs, Iowa, USA) and europe-west4 (Eemshaven, Netherlands), each of which used two NICs. As usual with TRex, one NIC was used for the actual traffic, and the other for connecting TRex test director (test orchestration/management). For TRex to work in the GCP environment, it must be running in software mode ![]() . Furthermore, when routing traffic through an external interface, traffic should be carefully crafted, as only valid ICMP/UDP/TCP traffic gets through Google’s network.
. Furthermore, when routing traffic through an external interface, traffic should be carefully crafted, as only valid ICMP/UDP/TCP traffic gets through Google’s network.
Business benefits of a customized network traffic generator
What is great about TRex is that you can modify the source code to suit particular project needs. Our modification to TRex enabled us to work with it in the cloud and use it as a transmitter and receiver at the same time. Thanks to the synchronization of clock times between different servers or service providers, even ones that are very distant from one another, we can perform reliable testing of cloud systems. Last but not least, our modification of TRex will allow you, too, to test your network performance in cloud environments and check the validity of new ideas without incurring serious costs. Solutions to measuring network traffic are incredibly expensive, but TRex, with a little modification from our R&D Team, can help you research new ideas while keeping costs in check.


