


There are many ways to generate data streams, this article presents some commonly used methods during test automation. The commercial solutions are more expensive (and of course, offer more features). However, there are a lot of cases where we can use non-commercial, free-of-charge solutions and tools to check things like predefined requirements, configurations, etc. This article covers some of them in more detail with use case examples of network testing.
Traffic generators
Traffic generators enable precise simulation of network conditions, allowing engineers to test device configurations under a variety of scenarios thoroughly.
This section covers tools like Ping, Traceroute, iPerf, SIPp, Ncat, and Trafgen - which provide a comprehensive automated testing suite - discussing how these various types of free tools can be utilized to simulate network traffic, assess device configurations, and conduct automated tests.
Ping
The Ping is one of the essential tools commonly used by anyone who knows how to use a console terminal. It allows verification of connectivity between hosts with a single command. Each OS's distribution can have different implementations, so not all switches/options are available - this article focuses on the Ubuntu distribution.
Generally, Ping command generates a continuous data stream that uses ICMP to detect communication issues. However, there are several ways to extend the functionality of the generated stream.
Useful options:
-s packetsize
   The number of data bytes to be sent.
-M [do|want|dont]
   Path MTU discovery strategy:
   do (set DF) prohibit fragmentation,
   dont (do NOT set DF) allow fragmentation,
   want automatically adjust frame size
-c count
   Send specified numbers of ECHO_REQUEST packets.
-i interval
   Wait interval seconds between sending each packets.
-Q tos
   Set QoS related bits in ICMP datagrams (decimal or hex numbers).
-O
   Report outstanding ICMP ECHO reply before sending next packet.
Let's take a look at some use cases and what we can achieve:
Minimal accepted packet time
*GOAL: A test needs to confirm if packets with minimal size can traverse through the network without modification (no MTU fragmentation):*
Command:
ping 10.236.8.74 -c 100 -s 1500 -M do -O
Results:
PING 10.236.8.74 (10.236.8.74) 1500(1528) bytes of data.
1508 bytes from 10.236.8.74: icmp_seq=1 ttl=64 time=0.432 ms
1508 bytes from 10.236.8.74: icmp_seq=2 ttl=64 time=0.500 ms
1508 bytes from 10.236.8.74: icmp_seq=3 ttl=64 time=0.468 ms
1508 bytes from 10.236.8.74: icmp_seq=4 ttl=64 time=0.470 ms
1508 bytes from 10.236.8.74: icmp_seq=5 ttl=64 time=0.491 ms


--- 10.236.8.74 ping statistics ---
100 packets transmitted, 100 received, 0% packet loss, time 4099ms
rtt min/avg/max/mdev = 0.325/0.357/0.407/0.029 ms
The above command sends 100 packets with a fixed size of 1500 bytes (1500 bytes payload + 8 bytes ICMP header + 20 byte IP header). If there is a device that performs fragmentation, the command displays a message “no answer yet for icmp_seq=1”.
QoS classification
*GOAL: A test needs to assess the QoS policy and the correctness of assignment traffic to traffic classes for simultaneous streams.*
Command:
ping 10.236.8.74 -c 10 -Q 88 &
ping 10.236.8.74 -c 10 -Q 40 &
ping 10.236.8.74 -c 10 -Q 0 &
Results:
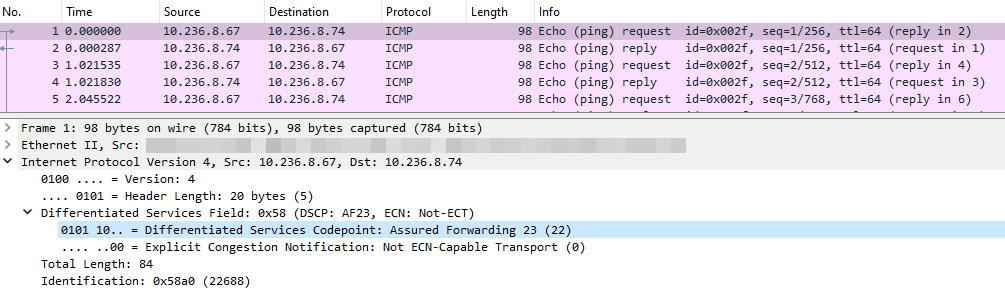
(ToS: 88 / DSCP: 22)
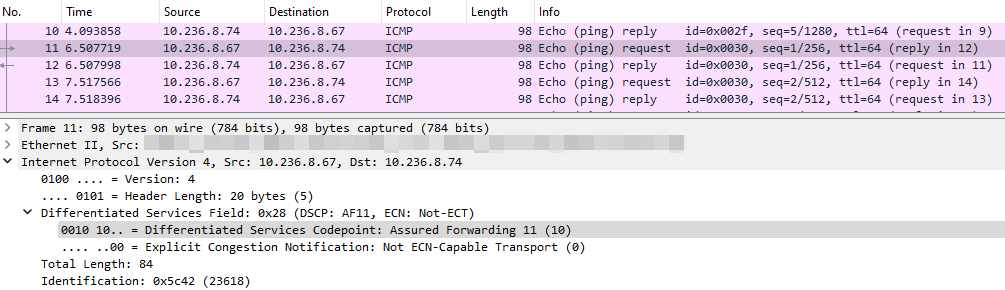
(ToS: 40 / DSCP: 10)
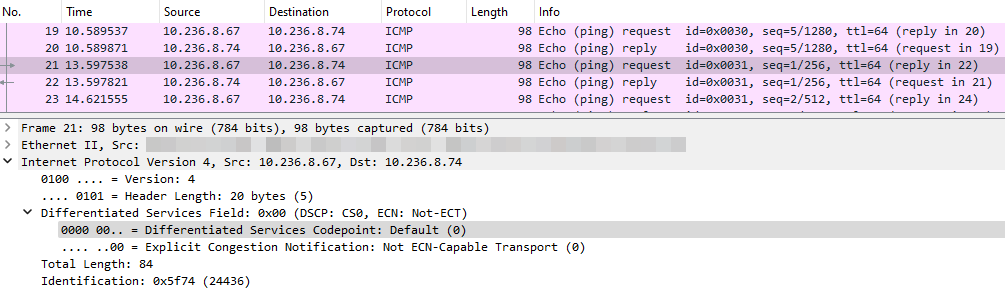
(ToS: 0 / DSCP: 0)
With these simple commands (usage of “&” allows the user to run the command in the background, which simulates parallel streams), the assignment of traffic to a specific QoS class can be achieved. Additionally, it is possible to add extra options like packet size or decrease the interval between packets (default 2s) to generate traffic load, fill up QoS buckets, and allow the testing of the expected behavior.
Host's availability
*GOAL: A test must confirm the host is online during the given timeframe, as defined by the test procedure.*
Command:
timeout 100s ping 10.236.8.74 -i 0.002
Results:
PING 10.236.8.74 (10.236.8.74) 56(84) bytes of data.
64 bytes from 10.236.8.74: icmp_seq=1 ttl=64 time=0.874 ms
64 bytes from 10.236.8.74: icmp_seq=2 ttl=64 time=0.160 ms
64 bytes from 10.236.8.74: icmp_seq=3 ttl=64 time=0.154 ms
64 bytes from 10.236.8.74: icmp_seq=4 ttl=64 time=0.149 ms
64 bytes from 10.236.8.74: icmp_seq=5 ttl=64 time=0.148 ms
64 bytes from 10.236.8.74: icmp_seq=6 ttl=64 time=0.809 ms
64 bytes from 10.236.8.74: icmp_seq=11 ttl=64 time=0.172 ms
64 bytes from 10.236.8.74: icmp_seq=12 ttl=64 time=0.170 ms
...
The above command generates a stream of packets (0.002s between them). Linux OS implementation does not limit the packet count (Windows OS sends only four packets), so it will send them infinitely. To avoid manually calculating how many packets should be sent, there is an additional command “timeout” to stop the process after a given time. A disadvantage of this process is that there is no summary at the end (because timeout will brutally stop the process) and it is necessary to get the summary result manually by adding the option “-O”.
Command:
timeout 100s ping 10.236.8.74 -i 0.002 -O
Results:
PING 10.236.8.74 (10.236.8.74) 56(84) bytes of data.
64 bytes from 10.236.8.74: icmp_seq=1 ttl=64 time=0.874 ms
64 bytes from 10.236.8.74: icmp_seq=2 ttl=64 time=0.160 ms
64 bytes from 10.236.8.74: icmp_seq=3 ttl=64 time=0.154 ms
64 bytes from 10.236.8.74: icmp_seq=4 ttl=64 time=0.149 ms
64 bytes from 10.236.8.74: icmp_seq=5 ttl=64 time=0.148 ms
64 bytes from 10.236.8.74: icmp_seq=6 ttl=64 time=0.809 ms
no answer yet for icmp_seq=7
no answer yet for icmp_seq=8
no answer yet for icmp_seq=9
no answer yet for icmp_seq=10
64 bytes from 10.236.8.74: icmp_seq=11 ttl=64 time=0.172 ms
64 bytes from 10.236.8.74: icmp_seq=12 ttl=64 time=0.170 ms
...
After comparing both results, it is clear that some packets are missing, depending on the test procedure conditions and expected outcome, and can be marked as failed or passed.
Traceroute
Traceroute generates several data flows that are almost identical simultaneously. The only difference is the TTL value (first flow TTL =1, second flow TTL = 2, etc.). Each device on the path analyzes the packets and decreases the TTL value by 1. If it drops to 0, the packet is dropped, and a proper response is sent to the source host. It is commonly known, however, that more options enable sending more complicated streams.
Useful options:
-I, --icmp
      Use ICMP ECHO for probes.
-T, --tcp
      Use TCP SYN for probes.
-U, --udp
      Use UDP for probes.
-M method
      Use specified method for traceroute operations.
      Method-specific options can be passed by -O.
-O option
      Specifies some method-specific option.
-t tos
      Set type of Service and Precedence value.
-n
      Do not try to map IP addresses to host names when displaying them.
-p
      Specifies the destination port.
Let's take a look at some use cases and what we can achieve:
Port availability on remote host
*GOAL: A test needs to confirm the host (8.8.8.8) can open a specific TCP connection (port 443) to the external host.*
Command:
traceroute -n -p 443 -M tcpconn -q 1 8.8.8.8
Results:
traceroute to 8.8.8.8 (8.8.8.8), 30 hops max, 60 byte packets
1  10.0.0.1  0.802 ms
2  10.225.103.125  3.266 ms
3  192.168.0.140  3.758 ms
4  10.80.8.1  3.983 ms
5  *
6  *
7  8.8.8.8  5.654 ms
With this simple method, the test can easily verify if any hops have configured a rule that blocks demanded traffic.
Usage – QoS classification
*GOAL: A test needs to test the QOS policy and the correctness of assignment traffic to traffic classes.*
Command:
traceroute -n -p 22 -T -O syn -t 80 192.168.0.140 &
traceroute -n -p 80 -T -t 40 172.16.0.128 &
traceroute -n -p 161 -U -t 0 10.10.0.1 &
Results will be similar to the test described earlier, but each flow sends several packets simultaneously. Additionally, if the output is analyzed, the test can confirm if there is a misconfigured router or firewall blocking the traffic.
iPerf
iPerf stands out as a highly recognized tool in the world of networking. It's versatile, working across different platforms, and uses a simple client/server setup. Many consider it essential for conducting bandwidth tests because it can measure various network parameters such as MSS/MTU size, packet loss, and delay jitter. At its core, iPerf is one of the best non-commercial choices in testing network throughput.
Generator with timeout
Regarding network automation, whether for functional or system testing, cleaning up the environment after tests are completed is crucial. Here is where built-in tools like”'timeout” come into play in conjunction with iPerf. The Linux “timeout” feature is handy for this purpose (the “timeout” feature was covered in previous paragraphs – Ping).
Here is an example of the server side:
Command:
tester@ubuntu-traffic:~$ iperf -s
------------------------------------------------------------
Results:
Server listening on TCP port 5001
TCP window size:  128 KByte (default)
------------------------------------------------------------
[  4] local 127.0.0.1 port 5001 connected with 127.0.0.1 port 48998
[ ID] Interval       Transfer     Bandwidth
[  4] 0.0- 5.0 sec   640 KBytes   1.05 Mbits/sec
and the client:
Command:
tester@ubuntu-traffic:~$ timeout 5 iperf -c 127.0.0.1 -b 1M
------------------------------------------------------------
Results:
Client connecting to 127.0.0.1, TCP port 5001
TCP window size: 2.50 MByte (default)
------------------------------------------------------------
[  3] local 127.0.0.1 port 48998 connected with 127.0.0.1 port 5001
[ ID] Interval        Transfer     Bandwidth
[  3]  0.0- 5.0 sec   640 KBytes   1.05 Mbits/sec
For example, applying a five-second timeout in front of the iPerf command ensures that the command automatically stops after five seconds. This approach helps in avoiding any unfinished tasks once the test is concluded. Similarly, adding a timeout before the iPerf server (“iperf -s”) command ensures a clean slate after testing, with no processes running in the background.
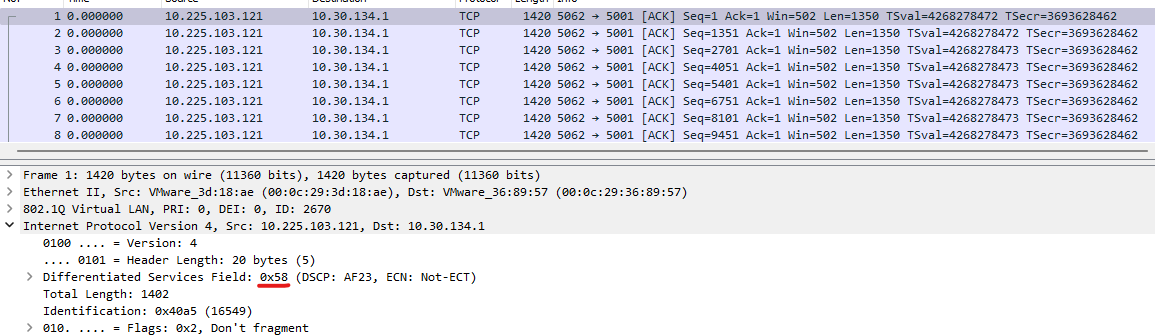
QoS classification
Another handy iPerf feature is the ability to set the Type of Service (ToS) on the source using the “-S” parameter, which accepts both hexadecimal and decimal values. It is particularly beneficial for Quality of Service (QoS) testing.
Command:
tester@ubuntu-traffic:~$ sudo ip netns exec 1-2121 iperf -s
------------------------------------------------------------
Results:
Server listening on TCP port 5001
TCP window size:  128 KByte (default)
------------------------------------------------------------
[  4] local 10.30.134.1 port 5001 connected with 10.225.103.121 port 5062
[ ID] Interval          Transfer     Bandwidth
[  4] 0.0- 1.9 sec      256 KBytes   1.08 Mbits/sec
[  4] local 10.30.134.1 port 5001 connected with 10.225.103.121 port 5063
Command:
tester@ubuntu-traffic:~$ sudo ip netns exec 6-2621 iperf -c 10.30.134.1 -b 1M -S 0x58
------------------------------------------------------------
Results:
Client connecting to 10.30.134.1, TCP port 5001
TCP window size: 45.0 KByte (default)
------------------------------------------------------------
[  3] local 10.0.0.2 port 36420 connected with 10.30.134.1 port 5001
Reverse traffic direction
Lastly, the “-R” option, which signifies reverse, is beneficial. It eliminates the need to switch the direction of traffic for tests manually. Simply using “-R” makes the server send traffic to the client, facilitating scenarios where testing throughput in both directions is necessary.
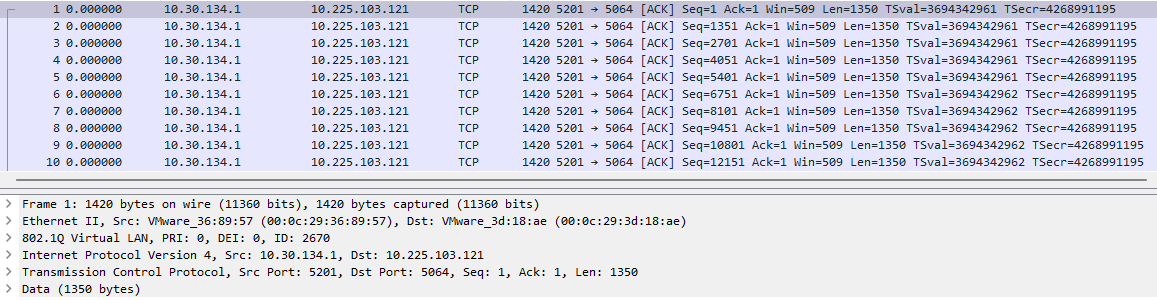
Command:
ester@ubuntu-traffic:~$ sudo ip netns exec 1-2121 iperf3 -s
-----------------------------------------------------------
Results:
Server listening on 5201
-----------------------------------------------------------
Accepted connection from 10.225.103.121, port 5063
[  5] local 10.30.134.1 port 5201 connected to 10.225.103.121 port 5064
[ ID] Interval            Transfer     Bandwidth         Retr  Cwnd
[  5] 0.00-1.00  sec      124 KBytes   1.02 Mbits/sec    0     42.2 KBytes
[  5] 1.00-2.00  sec      128 KBytes   1.05 Mbits/sec    0     44.8 KBytes
[  5] 2.00-3.00  sec      128 KBytes   1.05 Mbits/sec    0     44.8 KBytes
Command:
tester@ubuntu-traffic:~$ sudo ip netns exec 6-2621 iperf3 -c 10.30.134.1 -b 1M -S 0x58 -R
Results:
Connecting to host 10.30.134.1, port 5201
Reverse mode, remote host 10.30.134.1 is sending
[  4] local 10.0.0.2 port 51548 connected to 10.30.134.1 port 5201
[ ID] Interval         Transfer     Bandwidth
[  4] 0.00-1.00  sec   247 KBytes   2.02 Mbits/sec
[  4] 1.00-2.00  sec   0.00 Bytes   0.00 bits/sec
[  4] 2.00-3.00  sec   128 KBytes   1.05 Mbits/sec
As a free tool, iPerf offers numerous benefits that can streamline the process of running automation tests, all without the need for complex, paid tools.
If you would like to read more about iPerf, you can refer to this article.
SIPp
SIPp is a versatile tool for testers and developers working with the SIP protocol (Session Initiation Protocol). SIPp allows for the simulation of both SIP client and server in one package, which is invaluable for testing the performance of VoIP networks and telecommunication systems.
What sets SIPp apart from other tools? Primarily its flexibility. You can use SIPp to generate SIP traffic using predefined test scenarios or create your own tailored to specific needs. It means you can simulate various network conditions and user behaviors to see how the system will respond.
Moreover, the flexibility of SIPp is further enhanced by its compatibility with Linux network namespaces (IP netns), which allows for the isolation of tests and simulations in separate network environments on the same hardware. It opens up new possibilities for advanced testing scenarios where control over the network environment is crucial for precise behavior analysis.
Let's take a look at how it can be run:
Server needs IP:
sudo ip netns exec 7-3131 sipp -sn uas 203.52.1.167
------------------------------ Scenario Screen -------- [1-9]: Change Screen --
  Call rate (length)   Port   Total-time  Total-calls  Remote-host
  1.0(0 ms)/1.000s   5060      20.02 s           11  10.242.231.2:5060(UDP)


  0 new calls during 0.000 s period       0 ms scheduler resolution
  0 calls (limit 27)                      Peak was 10 calls, after 10 s
  0 Running, 12 Paused, 0 Woken up
  0 dead call msg (discarded)             0 out-of-call msg (discarded)
  0 open sockets                          0/0/0 UDP errors (send/recv/cong)
  0 open sockets                          0/0/0 UDP errors (send/recv/cong)


                                      Messages   Retrans   Timeout   Unexpected-Msg
  0 :      INVITE ---------->         11         0         0
  1 :         100 <----------         0          0         0         0
  2 :         180 <----------         11         0         0         0
  3 :         200 <----------  E-RTD1 11         0         0         0


  4 :         ACK ---------->         11         0
  5 :              [ NOP ]
  6 :       Pause [   8000ms]         11                             0
  7 :              [ NOP ]
  8 :       Pause [   1000ms]         11                             0
  9 :         BYE ---------->         11         0         0
 10 :         200 <----------         11         0         0         0


------ [+|-|*|/]: Adjust rate ---- [q]: Soft exit ---- [p]: Pause traffic -----
Client:
sudo ip netns exec 8-3333 sipp -sf sipp_files/uac_pcap.xml 203.52.1.167
The client must point to the directory with the profile scenario. SIPp comes with predefined scenarios. You can always craft your own scenario.
------------------------------ Scenario Screen -------- [1-9]: Change Screen --
  Port   Total-time  Total-calls  Transport
  5060    9358.98 s          602  UDP


  0 new calls during 0.692 s period       1 ms scheduler resolution
  0 calls                                 Peak was 14 calls, after 44 s
  0 Running, 2 Paused, 1 Woken up
  0 dead call msg (discarded)
  3 open sockets                          0/0/0 UDP errors (send/recv/cong)
  0 Total RTP pckts sent                  0.000 last period RTP rate (kB/s)


                                    Messages  Retrans   Timeout   Unexpected-Msg
0 :  ----------> INVITE             602       0         0         0


1 :  <---------- 180                602       0
2 :  <---------- 200                602       4         0
3 :  ----------> ACK         E-RTD1 602       0         0         0


4 :  ----------> BYE                602       0         0         0
5 :  <---------- 200                602       0
6 :  [   4000ms] Pause              602                           0
------------------------------ Test Terminated --------------------------------
----------------------------- Statistics Screen ------- [1-9]: Change Screen --
  Start Time             | 2023-11-15   10:02:07.808153 1700042527.808153
  Last Reset Time        | 2023-11-15   12:38:06.094351 1700051886.094351
  Current Time           | 2023-11-15   12:38:06.786775 1700051886.786775
-------------------------+---------------------------+--------------------------
  Counter Name           | Periodic value            | Cumulative value
-------------------------+---------------------------+--------------------------
  Elapsed Time           | 00:00:00:692000           | 00:00:00:692000
  Call Rate              |    0.000 cps              |    0.064 cps
-------------------------+---------------------------+--------------------------
  Incoming calls created |        0                  |      602
  Outgoing calls created |        0                  |        0
  Total Calls created    |                           |      602
  Current Calls          |        0                  |
-------------------------+---------------------------+--------------------------
  Successful call        |        0                  |      602
  Failed call            |        0                  |        0
-------------------------+---------------------------+--------------------------
  Response Time 1        | 00:00:00:000000           | 00:00:00:000000
  Call Length            | 00:00:00:000000           | 00:00:00:000000
------------------------------ Test Terminated --------------------------------
SIPp is also open source, meaning it has support from the community, and users can modify and extend its functionality to better meet individual needs.
Although SIPp might seem complex at first contact, its flexibility and powerful capabilities make it an invaluable tool in the hands of experienced testers.
Ncat
Ncat is a network utility that sends and receives data across the network using a CLI terminal. This simple fact and feature-rich implementation allows testing two-way communication between hosts, which can verify simultaneous communication in server-client architecture, such as HTTP servers. It may not be as powerful as complete HTTP applications (Apache, Nginx). However, CLI management (no complicated configuration file needed) and flexibility are huge advantages.
Simple 2-way communication
Let's focus on the basic client-server architecture to test some firewall rules.
Start Ncat in server mode (listening mode):
sudo ncat -lnvkp 9000 -c 'while true; do echo $(date); sleep 1; done'
The above command starts a server that listens (“-l”) on a specific port (“-p 9000”), does not close automatically (“-k”, “`--keep-open”), and executes then returns the command “date” (“-c”) to the initiator of the connection.
Command:
sudo ncat -lnvkp 9000 -c 'while true; do echo $(date); sleep 1; done'
Results:
Thu Feb 29 09:33:24 CET 2024
Thu Feb 29 09:33:25 CET 2024
Thu Feb 29 09:33:26 CET 2024
Thu Feb 29 09:33:27 CET 2024
Thu Feb 29 09:33:28 CET 2024
Thu Feb 29 09:33:29 CET 2024
The server is still waiting for the connection so the automation tool can trigger several sessions to check additional conditions and then analyze the output:
Ncat: Version 7.80 ( https://nmap.org/ncat )
Ncat: Listening on :::9000
Ncat: Listening on 0.0.0.0:9000
Ncat: Connection from 10.236.8.63.
Ncat: Connection from 10.236.8.63:32818.
Ncat: Connection from 10.236.8.67.
Ncat: Connection from 10.236.8.67:42562.
Ncat: Connection from 10.200.20.7.
Ncat: Connection from 10.200.20.7:22172.
This way, the firewall devices observe full two-way TCP communication and can easily track proper sessions (instead of generating one-way TCP traffic).
Simple web server
Another functional configuration of the server allows running a simple HTTP server. To begin, create a simple HTML file (“example.html”):
<html>
  <body>
    <h1>Hello, world!</h1>
  </body>
</html>
Then again start the server (“<” redirects the content of the file to be executed):
ncat -lvk -p 9000 --sh-exec "echo 'HTTP/1.1 200 OK \r\n'; cat example.html"
The client's host uses Ncat as a simple web browser:
Command:
ncat -C 10.236.8.99 9000
Results:
HTTP/1.1 200 OK

<html>
  <body>
    <h1>Hello, world!</h1>
  </body>
</html>
This tool is particularly helpful in automated verifications of HTML content and responses.
Trafgen
In the world of network engineering, simulating real-world scenarios is crucial for testing and optimization. However, the complexity and cost of commercial tools (IXIA, Spirent) can be a real blocker in a cost-optimized environment. Trafgen, a command-line tool, simplifies this process. Trafgen allows packet manipulation across various protocols, including IP, TCP, and UDP, making it an ideal choice for network automation tests.
Trafgen offers two primary methods for crafting packets: manual configuration or conversion from pcap files using netsniff-ing. The manual approach allows tailoring packets from the ground up, supported by manual and online examples ![]() . This flexibility is one of Trafgen's great features.
. This flexibility is one of Trafgen's great features.
For instance, you can create and adapt a configuration template for various tests by passing different argument values. This method is significantly more efficient than modifying the configuration file for each test. Consider the following command:
sudo ip netns exec 6-2711 timeout 5 sudo trafgen --dev ens192.2711 --conf icmp.cfg
--define SRC_IP=10.0.0.2 --cpp -b 1pps
This example illustrates how a single configuration template can streamline multiple tests by changing the source IP.
Here's a simplified example of what a Trafgen configuration file might look like, demonstrating the use of the C preprocessor for dynamic value assignment:
/*
 * Utilize --cpp for C preprocessor calls.
 */
 #define ETH_P_IP        0x0800


 #ifndef DST_MAC
 #define DST_MAC  00:0c:29:ce:eb:fa
 #endif


 #ifndef DST_IP   /* Destination IP */
 #define DST_IP   10.30.30.18
 #endif


 {
   /* Ethernet Header */
   eth(daddr=DST_MAC,
   #ifdef SRC_MAC
      saddr=SRC_MAC,
   #endif
      proto=ETH_P_IP),


   /* IPv4 Header */
   ipv4(ttl=64,    /* IPv4 TTL */
      proto=1,  /* Protocol ICMP */
      da=DST_IP, /* Destination IP */
   #ifdef SRC_IP
      sa=SRC_IP, /* Source IP via cmdline: --define SRC_IP=198.18.50.2 */
   #endif
   ),


   /* ICMP Header */
   icmp4(type=8, /* Echo-request */
      code=0,
      id=42,
      seq=dinc(1)),


   /* Payload */
      fill('B', 22),
}
Trafgen distinguishes itself in the network automation toolkit for its precision and efficiency in generating network traffic.

Summary
This article talked about tools many network engineers might already be familiar with. However, when we start thinking about automating tasks with these tools, we can discover many new uses for them. Tools like Ping, Ncat, Traceroute, and iPerf have various options that cover most testing needs. While some of these tools come ready to use, others might need you to install extra packages or do a bit of setup. However, overall, they're easy to handle within a variety of test scenarios. All of this makes the above-mentioned tools a good free alternative to the paid and harder to learn, commercial solutions.


