


In this article, we will build a sample service to see how to process logs in a Service Mesh and what information we can get from them. As a concrete example, we will use Istio and Envoy proxy to intercept and process container logs.
There are many use cases that can be built on top of log processing but in this post, we will
use it to discover REST API endpoints.
Since there are many things involved in such a setup, prior knowledge of Kubernetes, service mesh concepts and some gRPC experience will definitely help.
To keep this article short, I will skip an explanation of the above technologies. Instead, I will point you to the available documentation at the end of this blog post.
Also, all PoC code will be written in Go. Again, to make it readable, I have skipped much of the code, only implementing a simple optimistic path.
This particular example is specific to Istio and will differ for other meshes.
This article is divided into two parts – if you prefer to jump straight to the code and working examples, just read the second part of this blog.
The source code for this blog can be found here ![]() .
.
If you are interested in reading and setting it up from the very beginning read Part I. What you need - environment setup section.
Part I. What you need - environment setup
We will use the following components for our PoC:
- Minikube
- Istio
- A custom container written in Go
Let’s start!
Minikube setup is straightforward, to set it up run the following commands (for full procedure see links at the end of this blog post):
curl -LO https://storage.googleapis.com/minikube/releases/latest/minikube-linux-amd64

sudo install minikube-linux-amd64 /usr/local/bin/minikube
Once the above commands are complete, start Minikube using (it will also set kubectl context automatically):
minikube start
Next, to install Istio please check out the following page ![]() for all the details.
for all the details.
In short, in the installation section you will find the following command:
curl -L https://istio.io/downloadIstio | sh -
It will download Istio to a local directory and will give instructions on the environment PATH setup (we need istioctl in PATH). Next, we need to enable Access Logs Service (ALS) logs during service mesh installation. This is required to redirect logs to the logs processor we are building. This can be done using a command such as:
istioctl manifest install --set meshConfig.enableEnvoyAccessLogService=true --set meshConfig.defaultConfig.envoyAccessLogService.address=envoy-receiver-svc.default.svc.cluster.local:65000 --set meshConfig.accessLogFile=/dev/stdout
In the meshConfig.defaultConfig.envoyAccessLogService.address parameter we are pointing Istio to a Kubernetes service which we will create later on.
To verify if all is set we can display the Istio config map using:
kubectl -n istio-system get cm istio -o yaml
There should be the following config section:
...
  	envoyAccessLogService:
    	address: envoy-receiver-svc.default.svc.cluster.local:65000
...
  	 enableEnvoyAccessLogService: true
Install demo application and log processor
First, we will add a namespace label to instruct Istio to automatically inject Envoy sidecar proxies when you deploy your application later:
kubectl label namespace default istio-injection=enabled
To test our log processor, we will install the default demo application from the Istio documentation:
kubectl create -f https://raw.githubusercontent.com/istio/istio/release-1.19/samples/bookinfo/platform/kube/bookinfo.yaml
To check if pods are running and have sidecar injected you can use the following Kubernetes command (use -n to specify namespace):
kubectl get pods
If all goes well pods should have two containers running in every pod, eg:
NAME                    READY   STATUS    RESTARTS   AGE
echo-8a795b47d-bddgs    2/2     Running   0          42s
Next, we need to install the Envoy logs receiver.
Before actually installing it, we need to build a custom Docker container since one is not publicly available. To do so we need to run the following commands (the first one will set a Minikube context for the image build):
eval $(minikube docker-env)
docker build -f build/Dockerfile . -t receiver:latest
Once that is done we can finally create the required RBAC and Envoy receiver deployment itself:
kubectl create -f deploy/cluster-role.yaml
kubectl create -f deploy/cluster-role-binding.yaml
kubectl create -f deploy/envoy-receiver.yaml
Correct roles are needed for the K8s controller to connect to the K8s API. Here I have decided not to use Helm to reduce the amount of code for reading.
Note: Since the Docker image we are using here is not publicly available, we need to build it for the first time. If you don’t you will see ErrImageNeverPull error in the kubectl get pods commands output.
Test it
The easiest test we can do is to run the curl command between containers of the demo application. Using the Istio documentation once more, we find the following command, which will work for our test:
kubectl exec "$(kubectl get pod -l app=ratings -o jsonpath='{.items[0].metadata.name}')" -c ratings -- curl -sS productpage:9080/productpage | grep -o "<title>.*</title>"
In the Envoy receiver logs we should see something like this (kubectl logs command):
2023/10/22 08:39:20 INFO receiving data...
2023/10/22 08:39:20 INFO found new API endpoint name=ratings endpoint=/ratings/0
2023/10/22 08:39:20 INFO found new API endpoint name=productpage endpoint=/productpage
2023/10/22 08:39:20 INFO receiving data...
2023/10/22 08:39:20 INFO found new API endpoint name=reviews endpoint=/reviews/0
To confirm what has been discovered we can use the REST endpoint (added to the Envoy receiver) using port forward and curl:
kubectl port-forward svc/envoy-receiver-svc 8080
curl http://localhost:8080/api/v1/endpoints |jq
The output should be similar to this one:
{
  "details": [
	"/details/0"
  ],
  "productpage": [
	"/productpage"
  ],
  "ratings": [
	"/ratings/0"
  ],
  "reviews": [
	"/reviews/0"
  ]
}
As you can see it contains a separate section for each service that has been discovered (service name is equal to what is created in K8s). It also contains a list of endpoints for each discovered service. As you can imagine, it can be extended with additional information like protocol, method, etc.
>> Here, you can read more about our environment services.
Part II. More about the code and PoC
The logical application flow can be described as follows:
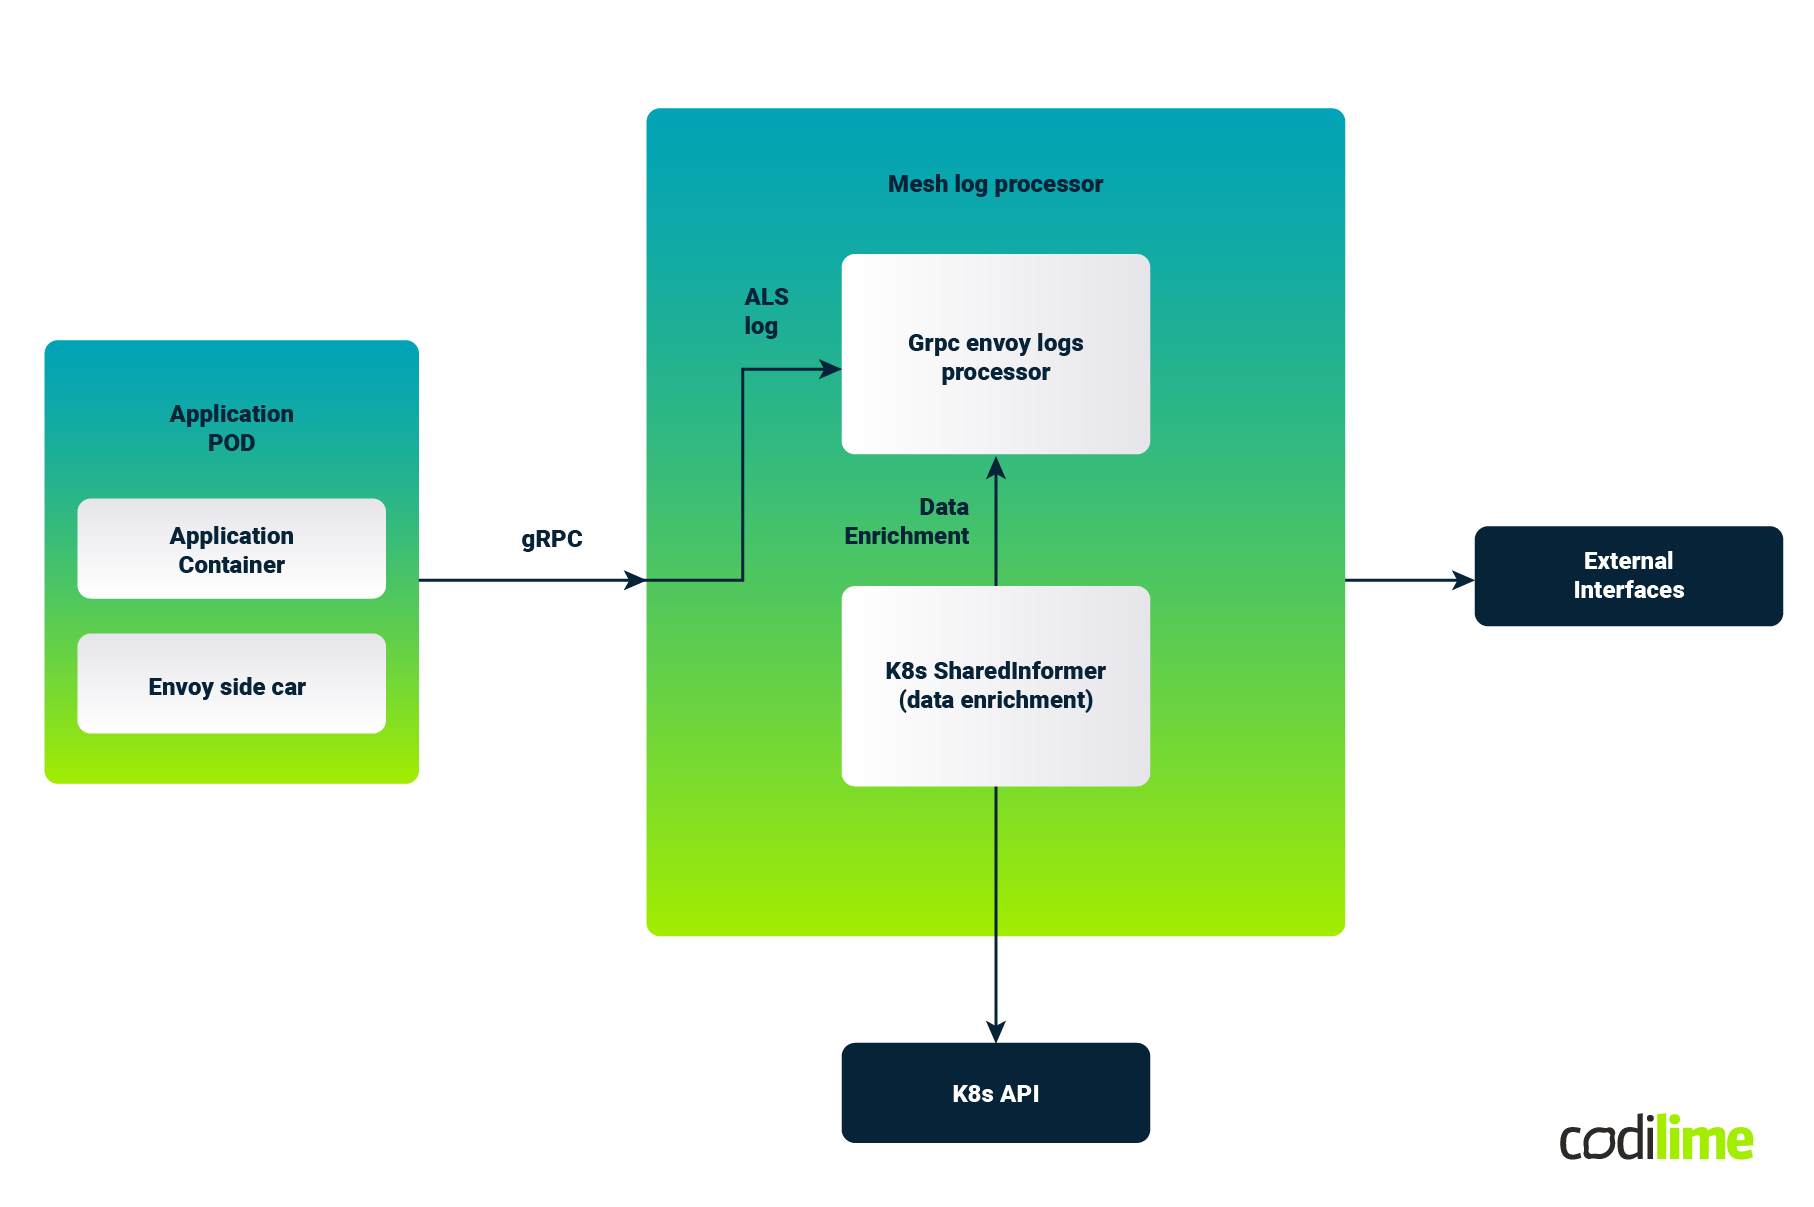
Above we can see a sample application Kubernetes Pod that contains a business application container and has injected the Envoy proxy sidecar which intercepts all the ingress and egress traffic for this application container.
The flow here is oversimplified and it's more complex on the Istio side. However, this should be sufficient for our PoC understanding.
During installation, we have configured Istio to send Envoy Logs to our logs processor (Envoy receiver).
It is one container which implements three functionalities:
- It acts as gRPC server that accepts protobuf encoded ALS logs (service-mesh-api-discovery/pkg/adapter/envoy.go)
- It is also a K8s controller for endpoints (service-mesh-api-discovery/pkg/k8s/client.go)
- There is also a REST endpoint, so we can check what has been processed so far (http://localhost:8080/api/v1/endpoints
 ).
).
Logs forwarded by Istio are processed by this custom component and API information is stored in the memory store of this container.
Kubernetes SharedInformer (controller)
As already described above, we need a component that will talk to Kubernetes and will get just enough data, so later when the Envoy log is received we will be able to enrich it. ALS logs are network logs and they do not contain all information about Kubernetes objects.
For this purpose, we will use Kubernetes SharedInformer (cache.SharedIndexInformer).
It is part of the k8s.io/client-go package.
In order to connect to the Kubernetes cluster we first need to create *rest.Config and once we have that we can then create *kubernetes.Clientset.
*kubernetes.Clientset allows us to obtain access and create factory objects, e.g.:
factory := informers.NewSharedInformerFactory(clientset, 1*time.Hour)
The above method takes two parameters - the already created clientset (way to talk to K8s) and the refresh period. In the example above, it instructs K8s to resend all objects that we’ve subscribed to, every hour.
I have chosen to use Endpoints Informer. This is perhaps a shortcut, and may not be sufficient for production use (depending on the use case, some other informers may be a better option like Deployment Informer etc.), but it works for our PoC:
factory.Core().V1().Endpoints().Informer()
Using this informer we can populate the map structure which will be our IP address for deployment name resolution.
This is done using a handler for newly added objects. Other events like object modification or deletion are not implemented, but again it should be in the production code.
The snippet below shows a more complete code section:
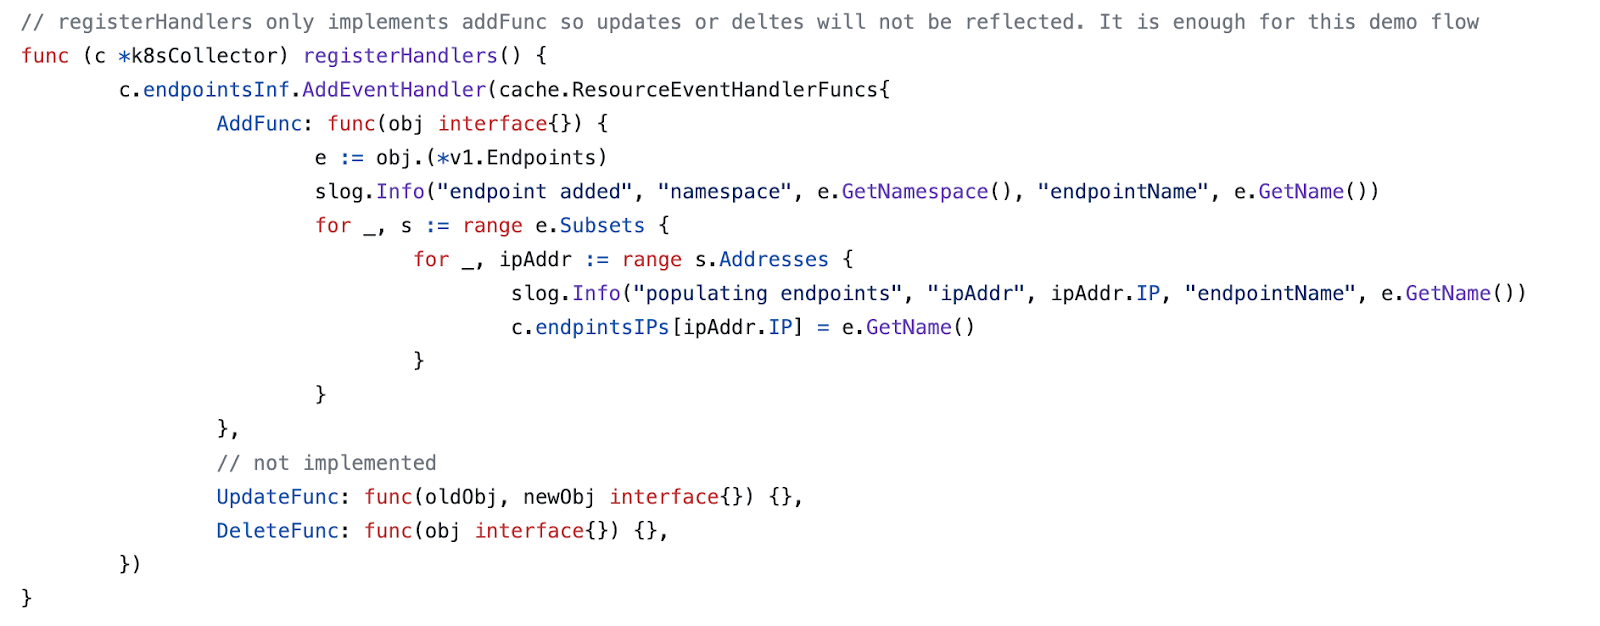
For the full code of the K8s collector please refer to:
service-mesh-api-discovery/pkg/k8s/client.go
Envoy logs receiver
The next of the two main components is the actual log processor. It is a gRPC stream receiver. As you remember when installing Istio we’ve pointed to the listener where logs should be sent.
Envoy has already prepared all the required protobuf definitions that we need. Those are part of the github.com/envoyproxy/go-control-plane package. In short, we need to implement the following method from the Envoy definition:
StreamAccessLogs(logs accesslogv3.AccessLogService_StreamAccessLogsServer) error
The above method will only process HTTP logs:
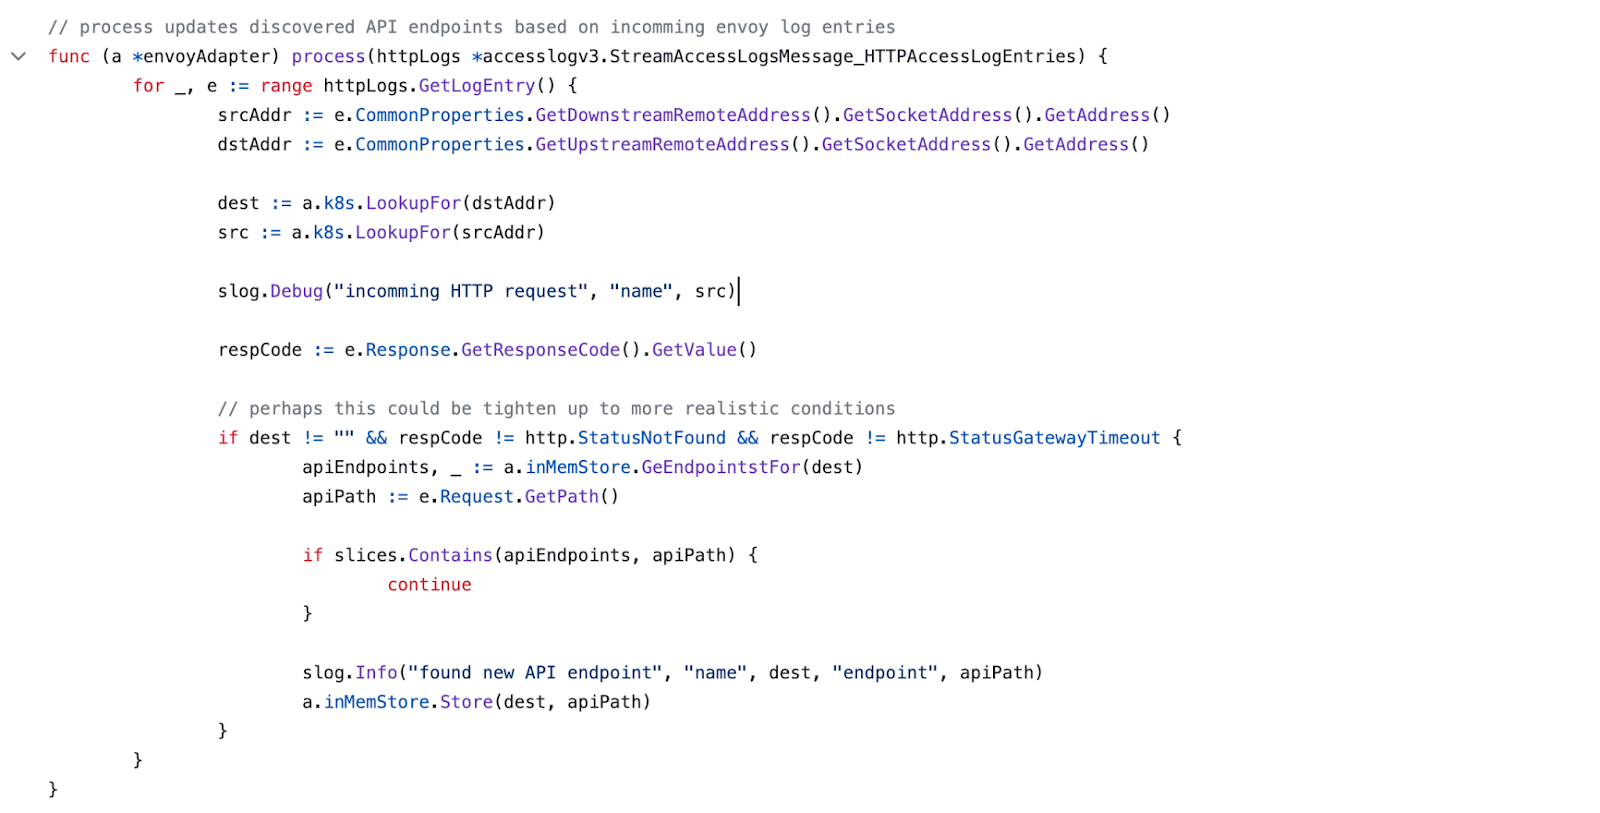
As you can see from the above code snippet, for every received log entry we try to look up the Kubernetes object name for a given IP address. By checking correct response codes we can assume that such an endpoint exists and therefore we add it to our in-memory API discovery inventory. Of course, once more in production, there will be more response codes that you may need to consider.
The K8s collector has the following interface which we use in the Envoy logs processor to enrich incoming HTTP logs:
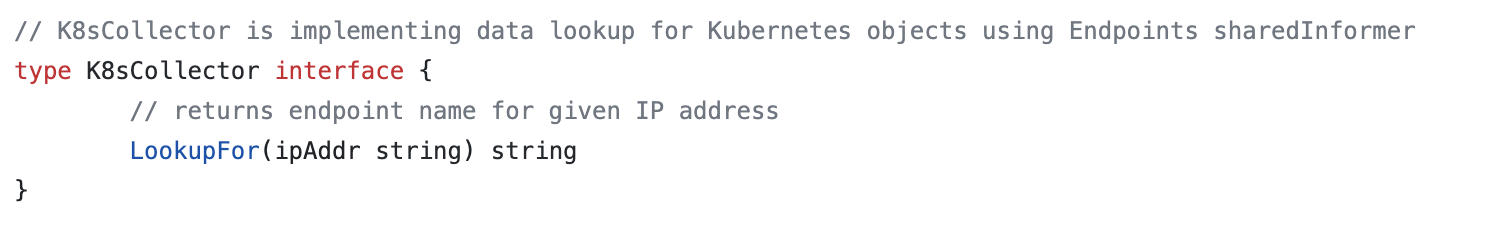
Once our implementation is “ready” we can register it as a gRPC receiver (service-mesh-api-discovery/cmd/receiver.go):

Again, for the full code of the K8s collector please refer to:
service-mesh-api-discovery/pkg/adapter/envoy.go
Summary
You made it! Hopefully, I have managed to describe the whole solution flow in a relatively short article.
Also, I have created a code path for just one use case but as you can imagine, with this approach many other use cases are achievable; for instance:
- API health monitoring based on response statuses,
- Metrics for different HTTP methods or protocols
- Another interesting use case that comes immediately to my mind is to measure the usage of given active endpoints


