


In-band network telemetry is one concept from a wide range of available solutions for network telemetry. If you want to know what this approach is all about and how it has been adopted so far, please read on.
What is in-band network telemetry?
Over the years, a wide variety of protocols, methods, and tools have been developed for network telemetry. These solutions are quite diverse and are used depending on the specific context and needs. Some time ago, one more concept appeared on the map: in-band network telemetry (INT), a method used for real-time data-plane observability. The approach here is to gather so-called telemetry metadata for packets traversing network segments. This may include per-hop telemetry data, such as:
- explicit information on packet routing paths,
- ingress and egress timestamps for all transit nodes,
- latency experienced by packets,
- queue occupancy in a given node,
- egress port link utilization in a given node, etc.
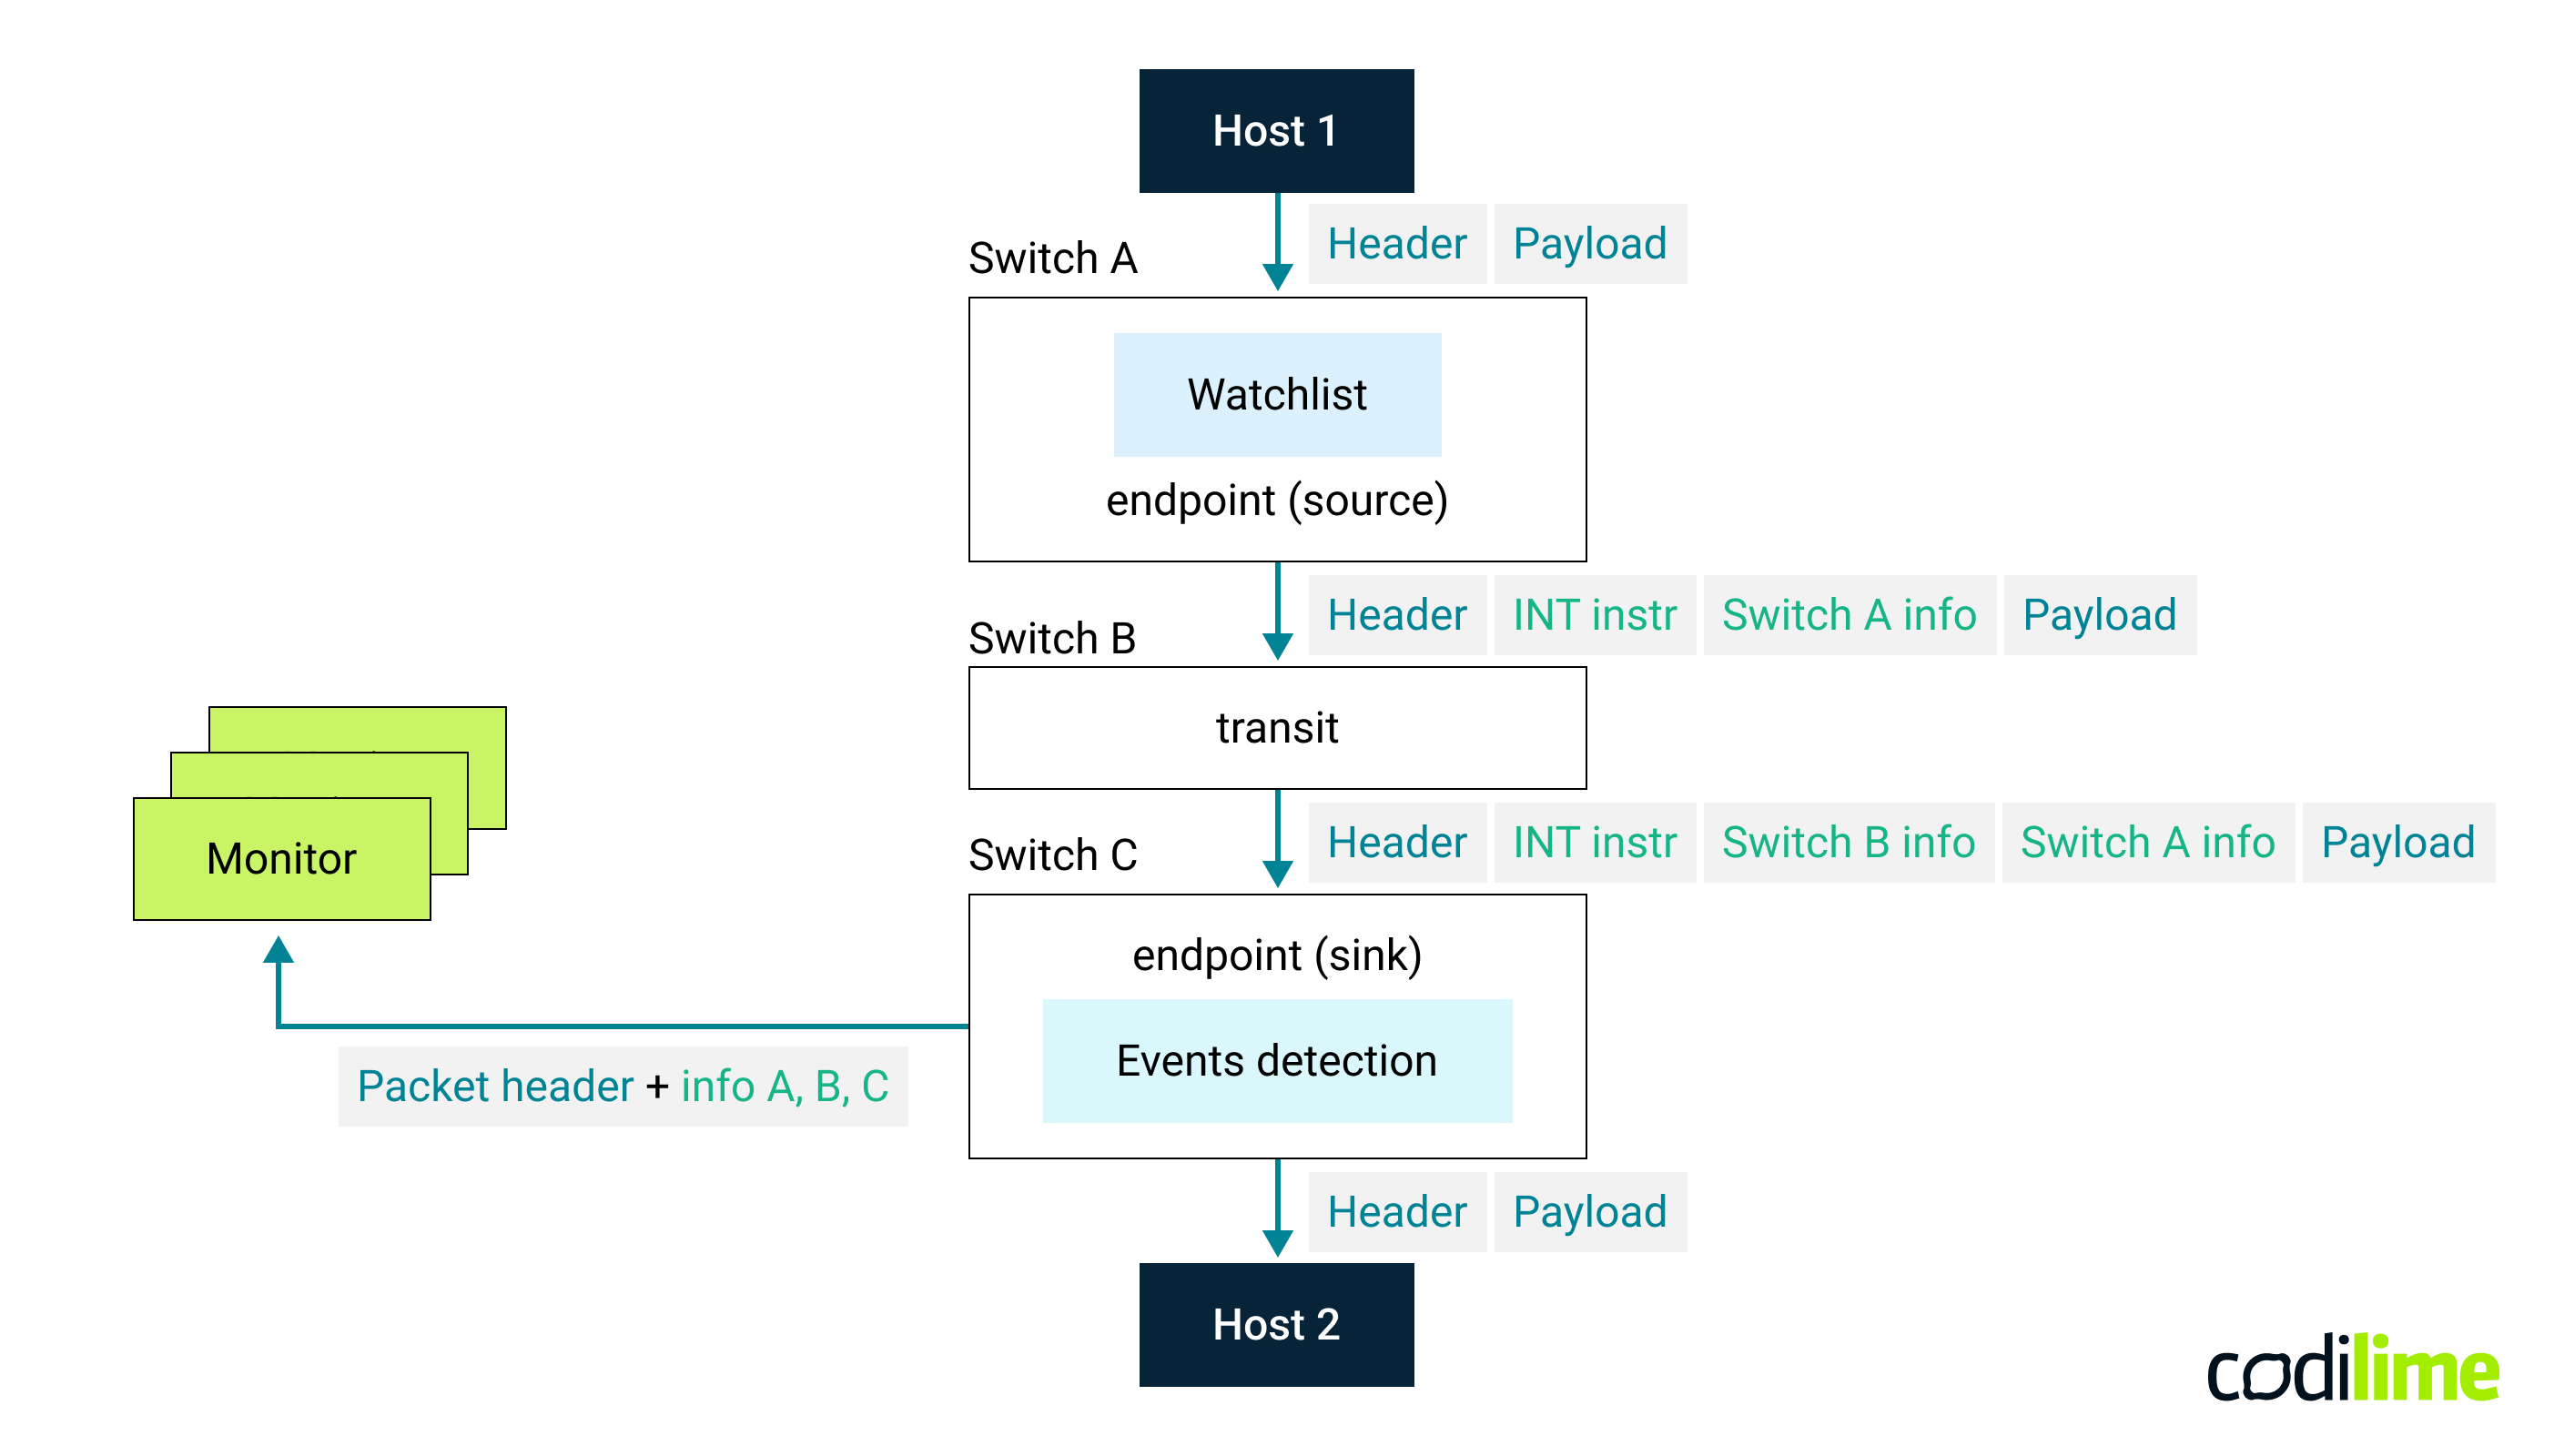
How does this work in practice? Let’s assume a very general scenario where packets are being sent between two given hosts in a network, forming a monitored INT flow path. As you may know, this is typically accomplished by employing a number of devices (routers, switches) that forward traffic along the entire routing path (see Fig. 1). Now, the following happens:
- The source node (i.e., the network device closest to the host that is sending the packet) inserts a telemetry header into the packet. The header contains instructions indicating which INT telemetry metadata should be collected at each node for a given packet flow on the entire routing path. This is configured in a so-called flow watchlist on the source node. Different flows can have different instructions specified. The source node then inserts its own telemetry metadata (“Switch A info”).
- Each transit node does the following when it receives the packet: first, it reads the instructions on which telemetry metadata to collect, inserting them at the top of the stack in the telemetry header (“Switch B info”, “Switch C info”, …) following the programmable data-plane logic defined for INT. This procedure is repeated until the packet reaches the so-called sink node, from which the destination end-host is reachable.
- The sink node extracts all telemetry metadata gathered in subsequent nodes. This is the so-called telemetry report that is sent to an external telemetry collector or analytics engine (monitor) for further analysis and processing. Optionally, the sink node can have additional logic implemented that decides when to generate and send such a report: should this be done for every single packet, or only when some specific conditions are met, or a specific event has occurred (e.g., telemetry received has abnormal values and may indicate a problem)?
It is worth mentioning here that the above method of collecting telemetry is not the only one. Different node behaviors in a network are possible, e.g., where each node directly sends its telemetry metadata to the collector. Then, only information about the instructions is added to the packets link-icon ![]() .
.
INT approach
In-band Network Telemetry (in short INT) was born in 2015 in the minds of engineers working on practical applications of the P4 language. These were mainly people from the Barefoot company (those who produced the Tofino chip, fully programmable in the P4 language), but also from Arista, Dell, Intel, and VMware. The idea itself was inspired by earlier attempts to implement the concept of active networks, in which packets carry pieces of code to be executed by routers (this interesting method allowed incredible flexibility in defining how the router should handle packets, but it was only implementable in FPGA). Shortly thereafter, INT was promoted by Barefoot (today a part of Intel) as one of the core solutions provided by Tofino chips. Since then, the idea of in-band network telemetry has generated an interest in the network community, especially those related to programmable data planes. Work on the specification link-icon ![]() and development of INT was undertaken by one of the P4 language community working groups.
and development of INT was undertaken by one of the P4 language community working groups.
INT instructions for network nodes
How are the INT instructions sent to the nodes along the packet route? The predefined telemetry metadata is encoded with a single bit within the INT metadata header. If a given bit is equal to 1, then its corresponding telemetry metadata has to be added to the packet by nodes in the network. This compact instruction bitmap is essential for controlling what each programmable switch contributes to the telemetry stack:
- bit0 : Node ID
- bit1: Level 1 Ingress Interface ID + Egress Interface ID
- bit2: Hop latency
- bit3: Queue ID+ Queue occupancy
- bit4: Ingress timestamp
- bit5: Egress timestamp
- bit6: Level 2 Ingress Interface ID + Egress Interface ID
- bit7: Egress interface Tx utilization
- bit8: Buffer ID + Buffer occupancy
Note: Level 1 interface ID represents the physical interface identifier, whereas Level 2 interface ID allows for gathering info about the logical interface specific to a particular device type.
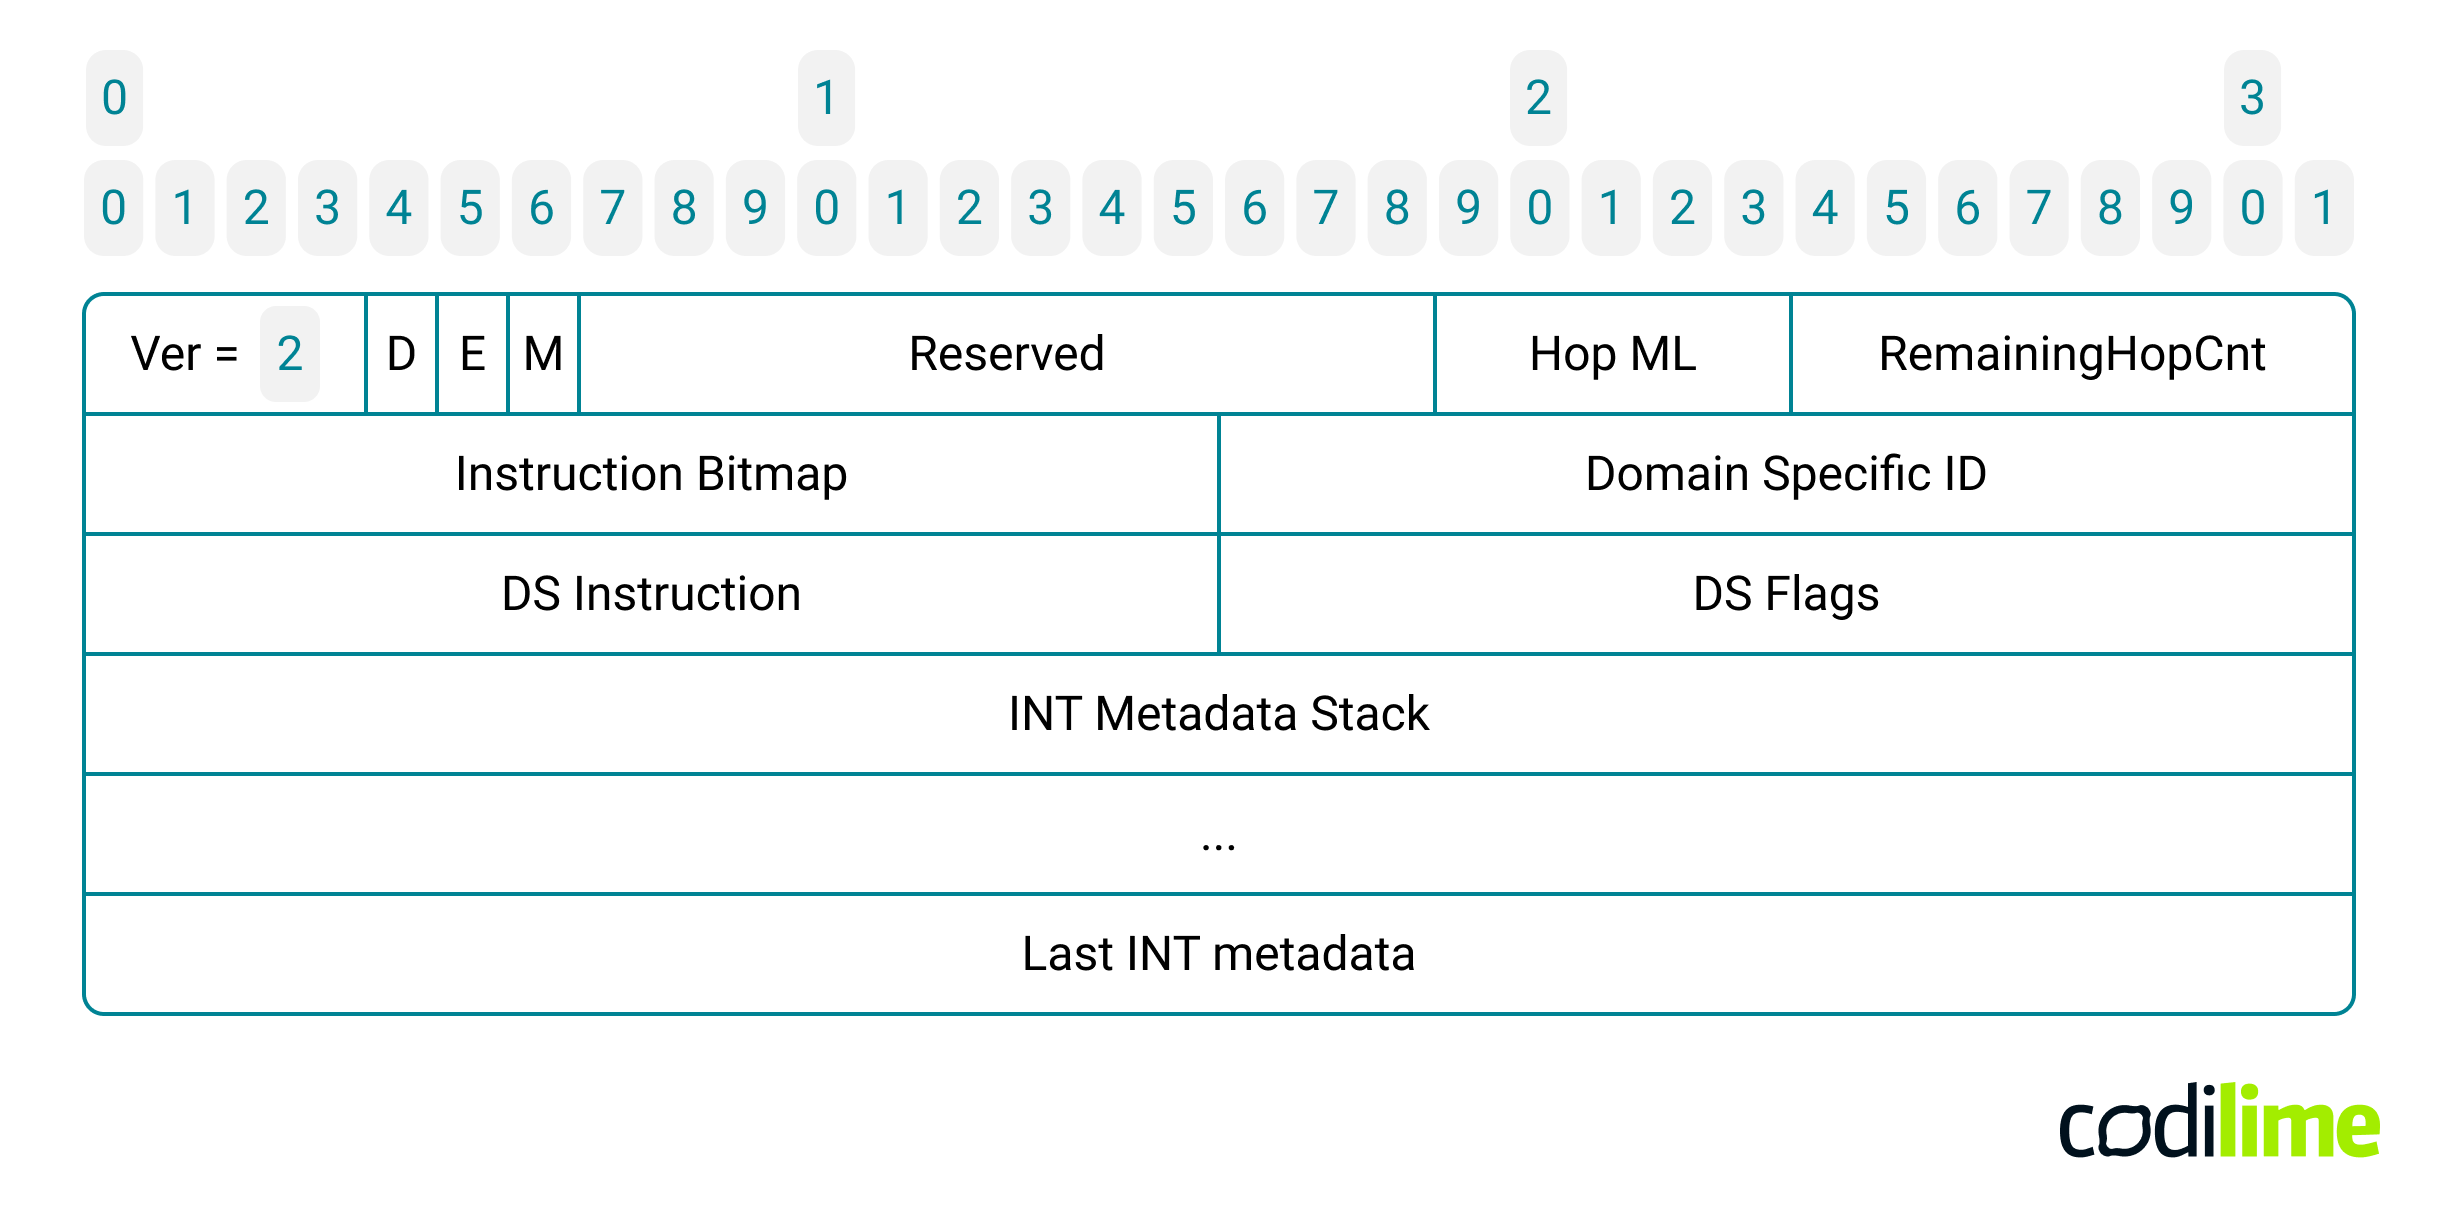
The INT specification defines a total of nine bits, which are grouped together in a 16-bit field called the Instruction Bitmap, a crucial element within the INT metadata header:
INT metadata gathering
The 12-byte-long INT metadata header is followed by a stack of INT metadata. Each telemetry metadata is encoded in 4 or 8 bytes. Since each switch adds exactly the same set of metadata, the length of the packet increases by a fixed number of bytes as it traverses each INT hop (i.e., switch). The INT node finds this value in the Hop ML field (Hop Metadata Length) of the INT metadata header. The maximum length of the INT telemetry data added by a single INT hop (when all specified instruction bits are set) is equal to 44 bytes. Therefore, when running INT in your network, be sure to configure a sufficiently large MTU (Maximum Transmission Unit) value and choose carefully which metadata you really need to gather!
This predictable per-hop metadata growth is one of the key considerations for scalable INT deployments.
Additionally, to limit the total amount of INT metadata in the packet and maintain control over packet length in the network, some form of safeguard is required. The INT metadata header includes the Remaining Hop Cnt field that tells how many more INT nodes can add metadata. This field is decremented by one in each INT node, and when it is equal to zero, it should not be possible for any further node to add metadata to the packet. To make it very explicit for each subsequent INT node, the relevant E flag is set in the INT header. An example of P4 code representing such a logic is presented below:
control INT_transit(...) {
    apply {
        if (!hdr.int_header.isValid())   // process INT packets only
           return;
        // check if INT transit can add a new INT node metadata
        if (hdr.int_header.remaining_hop_cnt == 0 || hdr.int_header.e == 1) {
           return;
        }
        remaining_hop_cnt_decrement();
        instructions_bitmap.apply();  // add INT node metadata based on instruction bitmap
        update_length_fields();  // update length fields in IPv4, UDP/TCP and INT headers
     }
}
Listing 1. The main logic of INT transit implemented as a P4 language control block
INT metadata Placement in Packets (INT shim header)
Placing an additional network header between existing layers can be quite problematic. The INT specification contains several examples of INT metadata locations within a packet. In almost every case, an additional preceding header is necessary. This is the so-called INT shim header. Its format strictly depends on the preceding transport header.
In the simplest implementations, the INT header is placed just after the TCP or UDP header (a modified header with a specific DSCP/TC field or a destination port number). This approach results in the least packet overhead, but requires that the network operator allocate a specific DSCP/TC field or a destination port number to indicate the presence of the INT header in the packet. That value must not be found in any non-INT packets. A much more flexible and safe way is to use tunneling protocols such as GRE, VXLAN, or GENEVE. However, here, many more bytes of overhead are to be expected as more protocol headers need to be added. This introduces common challenges in in-band telemetry packet encapsulation.
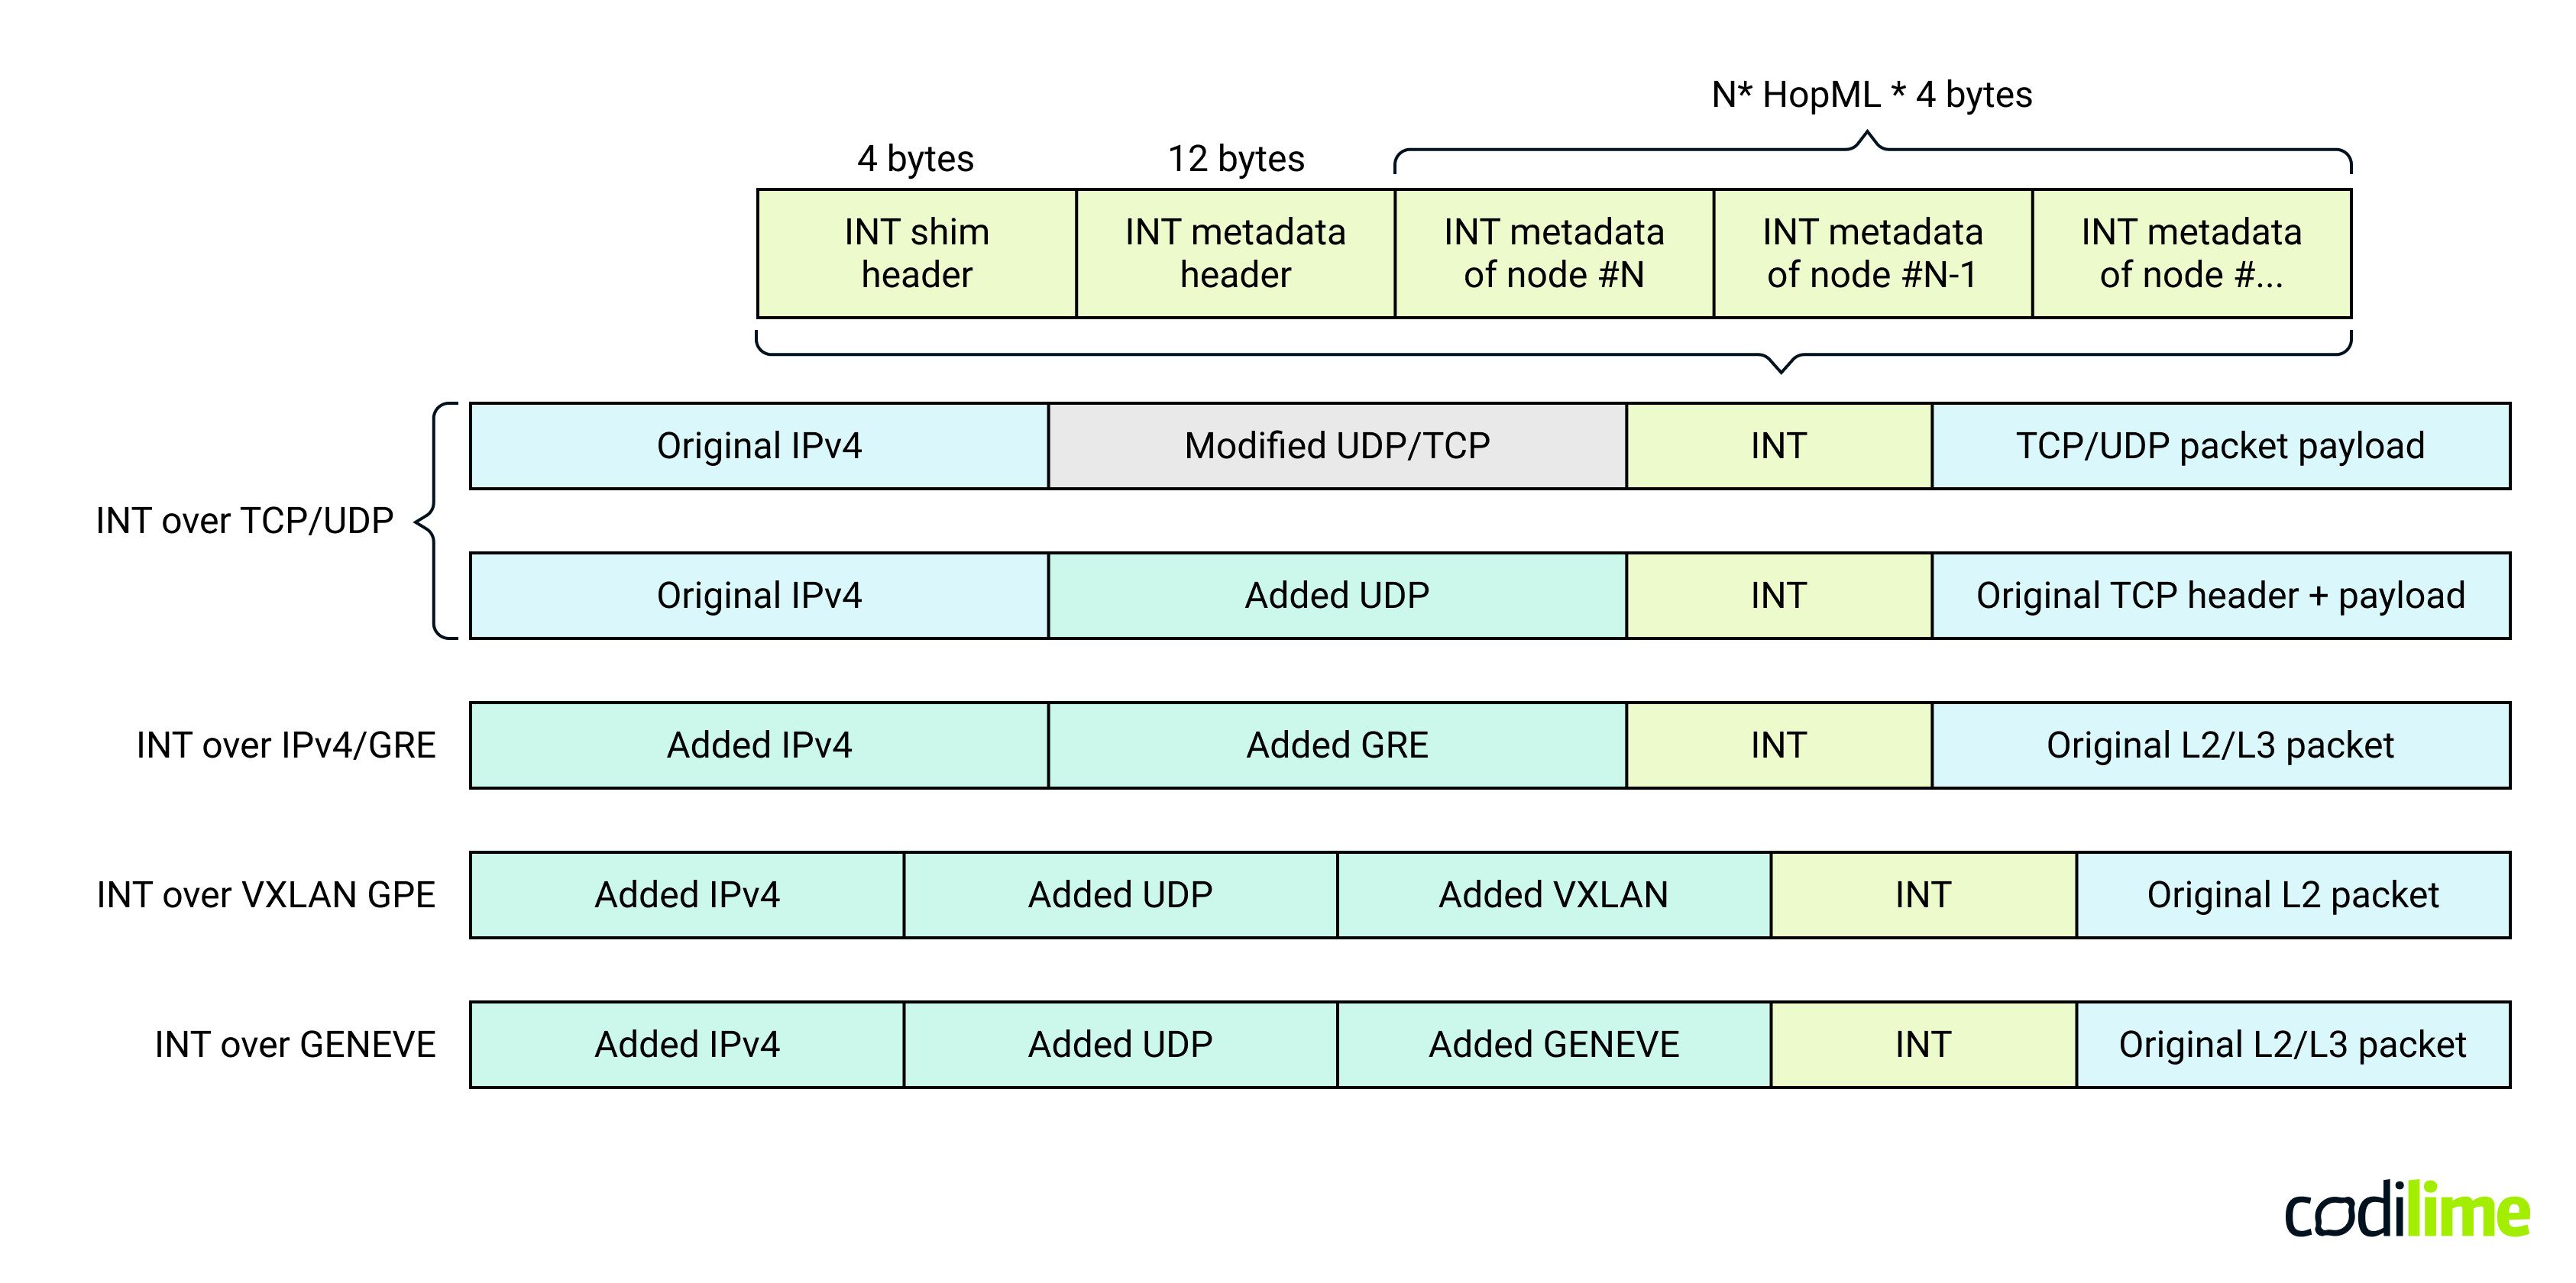
In all cases, INT is placed after the Layer 4 header or after the tunnel header which means that INT packets can be processed by most network devices even if they do not support INT. In such a case, they will not parse the INT metadata header and will not insert INT metadata in packets (as they do not support the required logic). Packets will be processed the standard way - transparently from an INT perspective. This behavior implies that INT can be gradually incorporated into existing networks.
INT metadata export to the monitoring system
When the INT packet reaches the sink node, the collected telemetry data must be copied and removed from the packet. The sink node copies not only the INT data itself, but also other headers, determining a flow for the gathered telemetry data. The INT sink sends a copy of a single packet or group of packets to the monitoring system, placing it in a UDP packet and prefixing it with appropriate telemetry report headers. The telemetry report format specification link-icon ![]() for INT is defined by the INT working group. In addition to removing the INT header and metadata, the sink node also needs to remove the tunneling protocol headers (if they are used). This way, the packet in the original form can be sent to the destination host or to another network domain. This export stage is important for telemetry collectors, analytics engines, and real-time network monitoring workflows.
for INT is defined by the INT working group. In addition to removing the INT header and metadata, the sink node also needs to remove the tunneling protocol headers (if they are used). This way, the packet in the original form can be sent to the destination host or to another network domain. This export stage is important for telemetry collectors, analytics engines, and real-time network monitoring workflows.
For more details of how INT works, see the INT specification link-icon ![]() .
.
INT solutions and implementations
There are several production-grade INT implementations available today. These implementations are frequently used in hardware-accelerated telemetry pipelines and P4-programmable networks. First of all, there are solutions leveraging INT offered by Intel (which acquired Barefoot in 2019):
- Intel® Tofino™ Series Programmable Ethernet Switch ASIC link-icon
 (e.g. used in: Arista DCS-7170, Marvel Teranyx 7 DC, Asterfusion CX-N, Lanner HTCA 6600),
 - Deep Insight Network Analytics Software link-icon - network monitoring, and analytics platform,
- Host-INT link-icon that implements INT using eBPF technology.
Other available options referencing INT are:
- KeySight IxNetwork SDN Test Solution link-icon (for testing INT implementations),
- ONOS link-icon ,
- GÉANT Data Plane Programmibilty link-icon with DPDK, Tofino and bmv2 implementations.
Other In-band Telemetry Approaches (IOAM, IFA, TCP-INT)
In addition to the INT specified by P4.org link-icon ![]() , several alternatives exist. These approaches offer different trade-offs in overhead, metadata granularity, and deployment complexity.
, several alternatives exist. These approaches offer different trade-offs in overhead, metadata granularity, and deployment complexity.
In-situ OAM (IOAM)
In 2016, the first IETF draft of IOAM appeared, an alternative framework for in-band network telemetry. This draft was created by a team from Cisco, but soon other companies joined it, including Facebook, Marvell, Huawei, and Broadcom. In 2022, the first few IOAM drafts became full-fledged RFCs: 9197 link-icon ![]() , 9322 link-icon
, 9322 link-icon ![]() , and 9326 link-icon
, and 9326 link-icon ![]() . IOAM has distinguished itself by developing several interesting options:
. IOAM has distinguished itself by developing several interesting options:
- determining how many network devices did not support in-band telemetry on the flow path,
- providing an accelerated traceroute service based on just a single packet.
Work on IOAM had a big impact on the development of INT at P4.org. Both INT and IOAM began to resemble each other in terms of functionality and are very similar generally. It is an open question whether the specification coming from P4.org will be further developed due to the existence of the IOAM RFCs.
Currently IOAM is implemented in Cisco IOS, Huawei CloudEngine CE6800 and CE8800 switches, VPP link-icon ![]() platform (the future support is not clear), and some level of IOAM support is available in the Linux kernel.
platform (the future support is not clear), and some level of IOAM support is available in the Linux kernel.
Inband Flow Analyzer (IFA)
This is another version of in-band network telemetry, this time implemented by Broadcom in the Trident 3 and Trident 4 chipsets. This chipset, together with IFA telemetry, is offered by manufacturers like Juniper in selected switches (e.g., QFX5120 link-icon ![]() ) and has been used to monitor the state of the network in the Alibaba cloud. The IFA specification is available online (IETF draft-kumar-ippm-ifa link-icon
) and has been used to monitor the state of the network in the Alibaba cloud. The IFA specification is available online (IETF draft-kumar-ippm-ifa link-icon ![]() ). The major differences in regard to other approaches are:
). The major differences in regard to other approaches are:
- the IFA header is located in an extension of the IP header, which is a less problematic option compared to INT over TCP/UDP,
- an option to place the telemetry metadata stack after the payload allowing IFA-monitored flows to pass through network gateways and firewalls,
- monitoring of longer paths - when IFA metadata could exceed the MTU, then telemetry metadata is immediately extracted from the packet by any IFA transit node and sent as a report to the monitoring system.
TCP-INT
This is another solution from Intel that came out in 2022. It is really a very lightweight telemetry approach. TCP-INT link-icon ![]() allocates a constant value of 12 bytes in a packet (the so-called TCP-INT header is embedded as a TCP option in the standard TCP header), regardless of the number of network nodes participating in the collection of telemetry data. TCP-INT collects information about the most loaded interface along the packet's routing path. A single 1-byte field in the header is used, which contains information about the percentage of link utilization or queue depth utilization (in case of 100% link utilization). Each node compares the value from that field (received in the TCP-INT header) with its local link utilization and replaces the value if a new maximum has been reached. The TCP-INT also accumulates packet processing latencies in each visited switch. The result (a sum of subsequent processing latencies) gives nanosecond-level precision because it is based on hardware clocks.
allocates a constant value of 12 bytes in a packet (the so-called TCP-INT header is embedded as a TCP option in the standard TCP header), regardless of the number of network nodes participating in the collection of telemetry data. TCP-INT collects information about the most loaded interface along the packet's routing path. A single 1-byte field in the header is used, which contains information about the percentage of link utilization or queue depth utilization (in case of 100% link utilization). Each node compares the value from that field (received in the TCP-INT header) with its local link utilization and replaces the value if a new maximum has been reached. The TCP-INT also accumulates packet processing latencies in each visited switch. The result (a sum of subsequent processing latencies) gives nanosecond-level precision because it is based on hardware clocks.
TCP-INT can be deployed not only on network devices but also on host machines. It is especially useful in the cloud environment where TCP-INT code may run on SmartNIC/DPU (Data Processing Unit) / IPU (Infrastructure Processing Unit) cards or as eBPF code in the Linux system. In such an environment, if TCP transmission takes place between two host machines, the receiver immediately sends the received telemetry data back to the sender. This way, the sender has a very fast and precise notification about the congestion on the path to the receiver and can reduce its transmission rate accordingly.
INT use cases
In-band network telemetry, by design, offers a very deep insight into what is going on in the network - especially in the context of packet processing at individual network nodes. Thanks to this, potential failures and problems, or even phenomena leading to them, can be detected early. This, in turn, allows you to respond to them appropriately. For example, this may include the following issues:
- traffic congestion analysis and mitigation (reactive/proactive enforcement of flows rerouting),
- packet loss/reordering detection,
- traffic microburst detection,
- fast indication of routing paths where significant increase in delay for given flows took place (this can be very helpful in 5G scenarios),
- recommending optimal traffic forwarding policies (also by detecting non-optimal configurations at the network node level in terms of number and type of forwarding rules, QoS policies, etc.),
- path tracing for ECMP networks,
- SLA monitoring,
- facilitating the identification of root causes for various types of issues occurring in networks,
- general network health monitoring.
Looking for a solution that helps you improve your network operations? Check out our network professional services.
Summary
In-band network telemetry is an extensible framework that records a packet’s journey as metadata is added to the live traffic packets. This kind of telemetry works at line-rate performance and gives very detailed visibility of the monitored traffic flows. In practice, INT provides exceptional insights for delay analysis, congestion detection, and programmable network monitoring.
However, you need to know that this approach is generally difficult to deploy and can be very costly. It may significantly increase the length of the monitored packets. It also requires strong computing resources to collect, aggregate, and analyze a very large volume of telemetric traffic. Be aware that monitoring each packet in a high-throughput flow can generate a big stream of telemetry reports to be analyzed. Therefore, research is underway on various mechanisms for the selective gathering of the most important telemetry data from network nodes. No less important are appropriate methods of data aggregation, processing, and storage (e.g., big data technologies and methodologies seem to be suitable here). It is also worth constantly looking for more optimal ways to transfer telemetry data within packets and to the monitoring collectors.
To sum up, any implementation of such technologies requires very careful consideration of the goals versus the related costs and effort, but INT continues to be one of the most interesting methods for line-rate, data-plane telemetry.


