


Network telemetry automatically collects data from routers, switches, and other devices, helping teams troubleshoot faster, optimize performance, and power intelligent automation.
In this article, you’ll learn what network telemetry is, how it works, and what protocols and data models are used.
What is network telemetry?
Network telemetry is the continuous collection and analysis of real-time data from network devices. It supports automated network operations by offering deep visibility into the behavior and performance of routers, switches, firewalls, and more.
The term "network telemetry" can be understood in different ways, and over the years, it has not been completely clear. Following the RFC 9232 ![]() (official definition of network telemetry), you will come across the following understanding of the terms "network telemetry" and "telemetry data":
(official definition of network telemetry), you will come across the following understanding of the terms "network telemetry" and "telemetry data":
- “Network telemetry is a technology for gaining network insight and facilitating efficient and automated network management. It encompasses various techniques for remote data generation, collection, correlation, and consumption.”
- “Any information that can be extracted from networks (including the data plane, control plane, and management plane) and used to gain visibility or as a basis for actions is considered telemetry data. It includes statistics, event records and logs, snapshots of state, configuration data, etc.”
It is worth noting that the above definitions are very broad. At least two important conclusions can be drawn from them:
-
There is no single preferred technique for implementing network telemetry (though some may fit certain use cases better than others).
-
Telemetry data can take many forms, including:
- configuration and operational parameters’ values (gathered from network elements)
- current values of different sorts of counters (e.g., related to the number of transmitted/received packets, etc.)
- any information related to the current state of the network
- packet samples or mirrored traffic streams
- End-to-end measured values such as unidirectional delays, round-trip-time (RTT), jitter, packet loss, etc.
This approach seems to make a lot of sense because it pushes strictly formal disputes into the background and focuses more on practical aspects.
Network telemetry - solutions characteristics
Existing network telemetry solutions are generally diverse, and it is not always easy to compare them in a straightforward way. Different methods or protocols are used for different purposes, and operate using fundamentally different mechanisms. However, there are several useful ways to classify them.
Two of the most common classification criteria are:
1. Passive vs. active telemetry
-
Active methods generate specific packet streams to measure network metrics.
- How it works: Tools send their own packets to measure latency, packet loss, jitter, or determine a routing path.
- Examples: ping, TWAMP, traceroute
- Use Cases: Best for on-demand diagnostics, reachability checks, and performance baselining.
-
Passive methods observe existing traffic streams without injecting new traffic to make measurements.
- How it works: No additional traffic is generated; data is collected from live streams already present in the network.
- Examples: sFlow, IPFIX
- Use case: Ideal for low-impact monitoring of ongoing traffic patterns.
2. Pull vs push working modes
-
Pull mode is based on direct requests for data from network devices.
- How it works: A client queries a device for specific data at regular intervals.
- Examples: SNMP, NETCONF
- Use case: Suitable for static polling and on-demand interaction with network devices
-
Push mode, also known as streaming telemetry, allows the device to send data proactively.
- How it works: A client subscribes to specific data sets, and the device pushes updates in real time whenever values change.
- Examples: gNMI, YANG Push (via NETCONF or RESTCONF)
- Use case: Ideal for event-driven automation
Network telemetry protocols at a glance
There are many protocols used for telemetry, each with its own purpose, method of operation, and data format. Below is an overview of the most widely used options, categorized for clarity, along with practical use cases.
| Protocol / Tool | Type | Telemetry Mode | Key Characteristics | Typical Use Case |
|---|---|---|---|---|
| Ping | Active | Pull | Uses ICMP to test reachability | Check if a host is reachable from a given source |
| TWAMP | Active | Pull | Measures forward/backward delay, RTT, jitter, packet loss | Accurate two-way or round-trip metrics measurement |
| Traceroute | Active | Pull | Uses ICMP, UDP, or TCP, depending on the implementation | Shows routing path and hop delays |
| sFlow | Passive | Push | Packet sampling at the forwarding chip level | Lightweight, high-speed traffic monitoring |
| IPFIX | Passive | Push | Flow-based export, high precision | Detailed traffic analysis without full packet capture |
| SNMP | - | Pull (+Trap) | UDP-based protocol, agents are running on managed devices | Legacy protocol for network management and monitoring |
| NETCONF | - | Pull | RPC-based, with XML encoding, uses YANG | Retrieve structured config/state data |
| RESTCONF | - | Pull | RESTful version of NETCONF, supports either XML or JSON encoding | Easier integration with web-based technologies |
| YANG Push | - | Push | Extends NETCONF/RESTCONF for subscriptions | Real-time updates of YANG-modeled data |
| gNMI | - | Pull/Push | gRPC-based, supports bi-directional streaming | Modern streaming telemetry with YANG support |
| INT / IOAM | Passive | Inline (In-band) | Embeds telemetry data into packets | Fine-grained, per-packet path and delay visibility |
A deeper look at common protocols for network telemetry
ping
Ping is a popular software diagnosis utility for IP networks available out of the box in many operating systems for PCs and network devices. Ping is used to test the reachability of hosts in the network. It uses ICMP Echo Request and Reply messages underneath. Ping typically reports RTT and packet loss.
TWAMP
The Two-Way Active Measurement Protocol provides a method for measuring two-way or round-trip metrics. TWAMP measurements may include forward and backward delays, RTT, packet loss, jitter, etc. TWAMP does not rely on ICMP Echo messages. Instead, it uses TCP and UDP.
traceroute
Traceroute is another software diagnosis tool for IP networking. It displays the entire routing path to the given destination as well as measures transit delays on this path. Depending on the implementation, traceroute can use ICMP, UDP and TCP packets.
sFlow
sFlow is a legacy technology used to monitor network devices using packet sampling (taking 1 out of every N packets going through the interface in real-time). sFlow’s sampling process is performed directly by the forwarding chip, of course, if it supports sFlow’s standards. The data, i.e., sampled packets combined with other data like interface counters, etc., is exported to the remote data collector over UDP for further analysis.
IPFIX
IPFIX is an open standard based on the Cisco Netflow v9 solution, but is also supported by other vendors. Similar to sFlow, IPFIX also exports data to an external data collector, but these are, in most cases, not sampled packets but aggregates of information related to particular flows in the network (a flow is a sequence of packets that matches a certain pattern). In this way, IPFIX allows a much higher precision of monitoring than in the case of simple packet sampling.
SNMP
For over thirty years, the Simple Network Management Protocol has been a widely used protocol for managing and monitoring network devices. The system architecture consists of a central manager (NMS - Network Management System) that communicates with agents installed on devices. SNMP works primarily in pull mode. Push mode is also supported (SNMP Trap), but it has some limitations.
NETCONF
NETCONF is a protocol for network management and data collection. It uses the YANG standard for data modeling and XML for data encoding. The way NETCONF works is based on the RPC (Remote Procedure Call) paradigm, where network devices act as NETCONF servers and external applications (e.g. managers, controllers) establish sessions with them acting as clients. In the context of telemetry, clients pull the specified data stored in so-called datastores on servers.
RESTCONF
RESTCONF is generally a similar protocol to NETCONF, but uses HTTP.
YANG Push
YANG Push is a set of standard specifications that allow for adding subscription functionality to NETCONF and RESTCONF. This way, clients can receive a stream of updates from a datastore.
gNMI
The gRPC Network Management Interface is a protocol based on the gRPC framework. As gRPC itself provides for various possible modes of message exchange between server and client, e.g., unidirectional or bidirectional streaming, gNMI natively supports a subscription-based telemetry model. gNMI works with YANG data models.
INT/IOAM
In-band Network Telemetry and In-situ OAM are twin concepts for so-called in-band network telemetry. This is a specific approach to telemetry, significantly different from those mentioned above. The idea here is to collect telemetry metadata for packets such as ingress/egress timestamps, routing path, latency the packet has experienced, queue occupancy in a given network device the packet visits, etc., and to embed them into packets (as headers, not data) when they traverse their routing paths. This approach offers a very detailed view of what is going on in the network, but also brings many issues to address. To learn more, check out the following blog post about Inband network telemetry (INT).
Top 4 challenges in network telemetry
Modern telemetry systems bring powerful observability to networks, but they also introduce unique design and operational challenges. The key challenges can be grouped into four main areas:
1. Achieving Fine-Grained Visibility
-
Telemetry needs high-resolution, frequent measurements to provide actionable insights.
-
Traditional polling-based monitoring often struggles with granularity and can miss transient issues.
-
Beware: Without sufficient resolution, telemetry data loses its ability to detect anomalies early.
2. Managing Network Impact
-
There are many different types of metrics that can be obtained from the network. The volume of telemetry data can be huge.
-
In most cases, however, specific network monitoring applications do not require all available types of data, therefore careful data scoping and prioritization is very important.
-
Why this matters: Uncontrolled telemetry streams can overwhelm the network rather than help optimize it.
3. Standardizing Data Models
-
Networks often use multi-vendor devices, each with its own data format and structure.
-
YANG data models offer a vendor-neutral approach, helping to unify configuration, state, and operational metrics.
-
Design implications: A consistent data model ensures compatibility and reduces integration friction.
4. Choosing Efficient Encoding & Transport
-
Different telemetry targets require different protocols (e.g., IPFIX/UDP for forwarding plane, NETCONF/RESTCONF/gNMI for control and management planes).
-
Efficient encoding methods reduce overhead and ensure faster processing.
-
Performance impact: The right protocol and encoding choice directly impact latency, reliability, and network performance.
Top Use Cases of Network Telemetry
Network telemetry is about using your collected data to take action. Below are the most common use cases for telemetry in modern network environments:
| Use Case | Why It Matters | |
|---|---|---|
| Performance Monitoring | Tracks device health, throughput, latency, jitter, and packet loss in real time | |
| Anomaly Detection | Detects unusual traffic patterns, spikes, or errors before they become outages | |
| Security Threat Detection | Identifies suspicious traffic flows, | |
| Capacity Planning | Forecasts future needs by analyzing trends in link and device usage | |
How telemetry fits into a larger observability system
It is good to know that network telemetry is not something isolated. It is usually part of a larger whole, e.g., systems containing many logical components, where network telemetry is just one of them.
For example, imagine a data center where bare-metal compute nodes are connected to a leaf-spine fabric ( a common deployment model). You want to build a system that can:
- Identify all sorts of infrastructure issues (including network problems)
- Generate appropriate alerts before they occur,
- Give your team time to react accordingly.
The high-level logic of such a system can be described as follows (see Fig. 1)
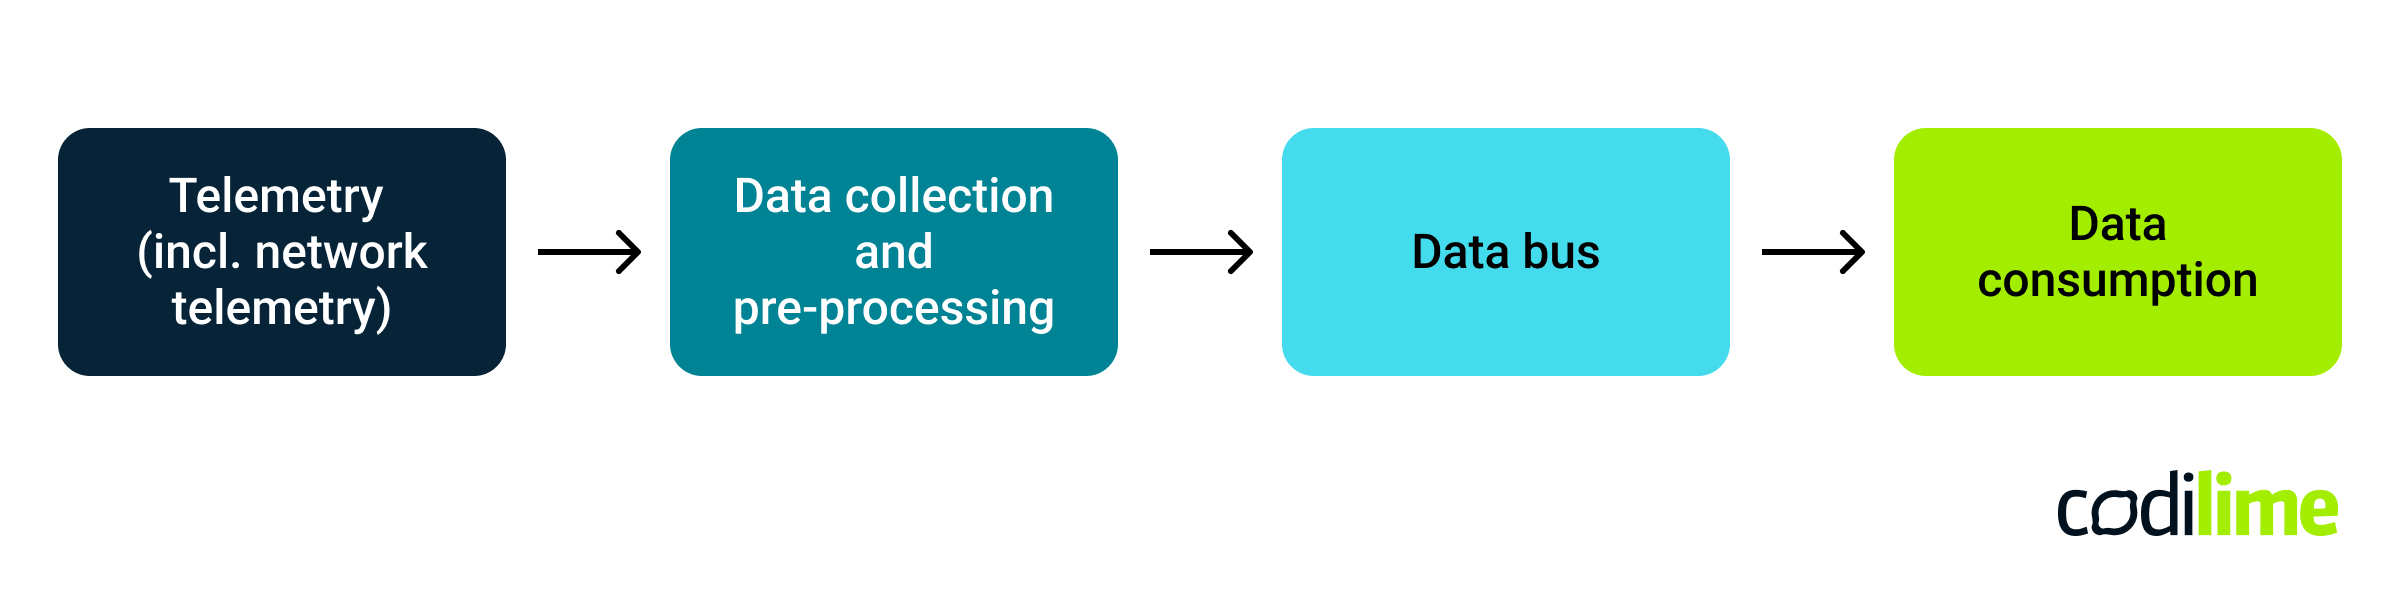
- Telemetry (including network telemetry) - this includes all telemetry mechanisms used at the infrastructure level, both for compute nodes and network devices
- Data collection and pre-processing - a set of agents/clients that receive raw telemetry data and transform it if needed
- Data bus - a distributed data streaming system; it could be Kafka, for example, or some similar solution
- Data consumption - various types of applications that operate on telemetry data to perform visualization, diagnostics, alerting, trending, forecasting, etc., depending on the business logic that has to be implemented in a given system.
Read more about network telemetry and observability:
- Talking telemetry, observability, and orchestration with Monika Antoniak and Edyta Kałka
- Which observability tool is right for you? A side-by-side comparison
Explore our network professional services to learn how we can support you.
Frequently Asked Questions (FAQ)
What is the purpose of network telemetry?
Network telemetry provides real-time visibility into network performance, configuration, and traffic patterns. Data collected from the network can then be used for various purposes such as troubleshooting, predictive maintenance, or capacity planning.
What protocols are commonly used for network telemetry?
Some of the most common telemetry protocols include SNMP, sFlow, IPFIX, NETCONF, and gNMI. Different protocols are suitable for different purposes, and different devices support different sets of protocols.
Is telemetry data secure?
Yes — modern telemetry protocols support encryption and access controls. For example, gNMI uses gRPC over TLS, and NETCONF can operate over SSH or TLS.
Summary
Network telemetry includes various techniques, protocols, and methodologies. It is quite a broad term. However, it is natural that today's needs in the context of network telemetry are a little different than, say, 20 years ago.
The way network functions are implemented has changed (more virtual appliances are present), there are new runtime environments (shift to data centers, clouds), architectural models have evolved, and new protocols, APIs, etc., have appeared. The general trend towards IT approaches and methodologies has taken place. Therefore, it can be expected that the essence of network telemetry will increasingly move from old classic terms like "network monitoring" towards such terms as observability, fine-grained visibility, network data subscription and consumption, etc.


