


What’s measured gets managed. Numbers have an important story to tell’. Whether Peter Drucker said this or not doesn't matter, it's true when designing digital products. Even if product design is often considered an art, it’s data collection that helps to create a better user experience. Web and application design choices should be based on real evidence about the user’s needs and behavior. Let’s explain what data-driven design is, why it is important, and how to define goals and metrics.
What is data-driven design?
Data-driven decision making ![]() is the process of creating user-friendly software or apps should always be guided by information about what works and what doesn’t. Very often, features that look good at the product discovery stage, turn out to be impractical or unnecessary. The result is rarely what you were aiming for. And this is why data-driven design has become one of the most impactful trends among UX and UI designers. Simply speaking, data-driven design is making informed design decisions. It’s a decision-making approach to the web or application design process that heavily relies on collected data about customers’ behavior and attitudes.
is the process of creating user-friendly software or apps should always be guided by information about what works and what doesn’t. Very often, features that look good at the product discovery stage, turn out to be impractical or unnecessary. The result is rarely what you were aiming for. And this is why data-driven design has become one of the most impactful trends among UX and UI designers. Simply speaking, data-driven design is making informed design decisions. It’s a decision-making approach to the web or application design process that heavily relies on collected data about customers’ behavior and attitudes.
What is data-driven design in UX?
Data-driven design in UX is an approach that leverages insights and information derived from user data to guide the design process. It involves using different UX data collection techniques to collect and analyze user behavior, preferences, and interactions with a product or service and then using this data to inform design decisions. By harnessing quantitative and qualitative data, such as user feedback, usability testing, and analytics, data-driven design aims to create user-centric experiences that are tailored to meet the needs and expectations of the target audience.
This iterative process allows designers to make informed decisions, validate hypotheses, and optimize the user experience based on concrete evidence.
Ultimately, data-driven design empowers UX professionals to create more effective, intuitive, and engaging digital products that resonate with users and drive business success.
How else can you avoid impractical and unnecessary features and design? Check the list of dos and don'ts of UX in network systems.

Quantitative and qualitative data
Let’s start with a short explanation of what data actually is when it comes to UI and UX design. There are two types of data you can gather: quantitative and qualitative data. Let’s learn more about each of them.
Quantitative data (numbers and measurement)
Quantitative data helps you identify how the product is performing. Such numerical data comes in the form of numbers and answers the questions how much, how many, how often, etc. For example: bounce rates, exit rates, time on site, the number of website visits, the number of people who have downloaded the app.
Qualitative data (observations and feelings)
Qualitative data is non-numerical data. This is information that can be captured but is not numerical in value. Qualitative research focuses on ‘why’ and gives you insights into user motivation and intent. For example: feedback from focus groups or user testing, user recordings, usability studies, competitor analysis, etc.
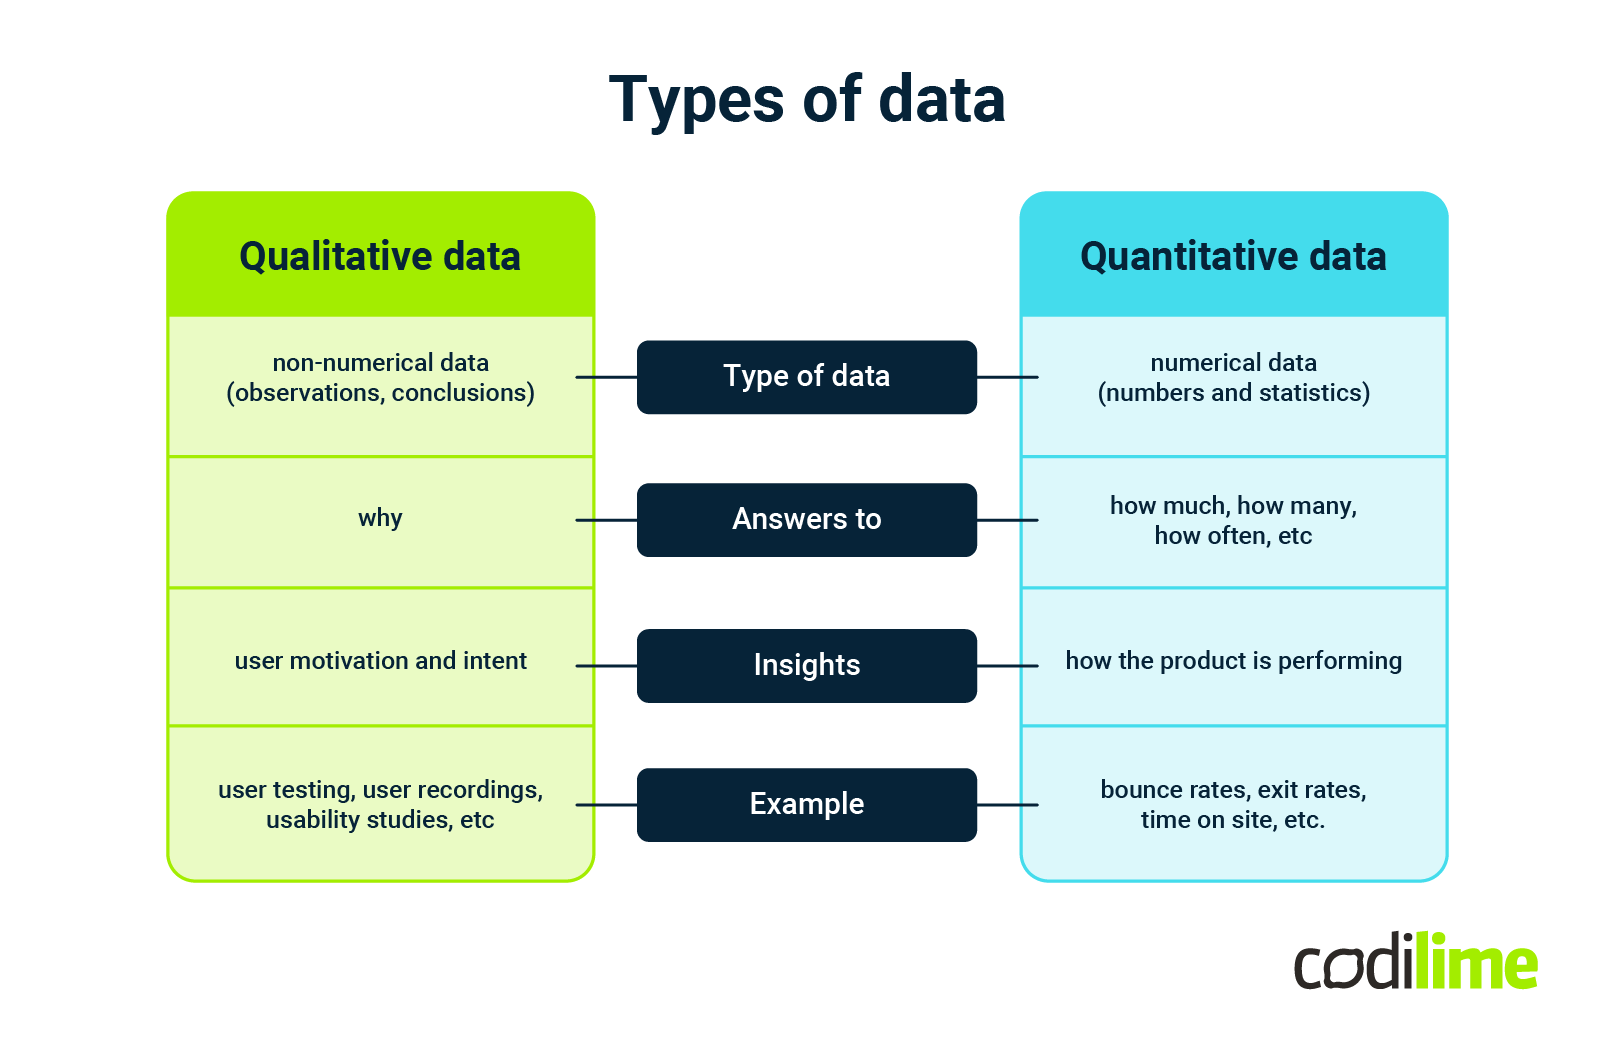
Note – responses can be given a statistical dimension when we count, for example, “how many responders had a problem with understanding the notification.”
Both types of data are valuable, and they should supplement each other.
Why is data-driven design important?
Not tapping into data in UX and UI design can be a very dangerous approach as it may lead to ineffective design. In consequence, this may result in a loss in revenue, further effort needed for redesign, or just wasted time. On the other hand, data-driven design can increase traffic, conversions, and finally, drive your business to overall success. By analyzing data, designers can identify areas for improvement within the UX design system, prioritize enhancements, and make data-informed decisions about which components or patterns to include or modify.
After all, data is here to help you. It can save time and resources and it usually decreases the number of iterations needed to get to the final product design and UX design. Data is a great way to validate your instinctive choices with evidence and better understand customers’ needs and motivations.
Still not convinced? Check why else UX design is important to your company.
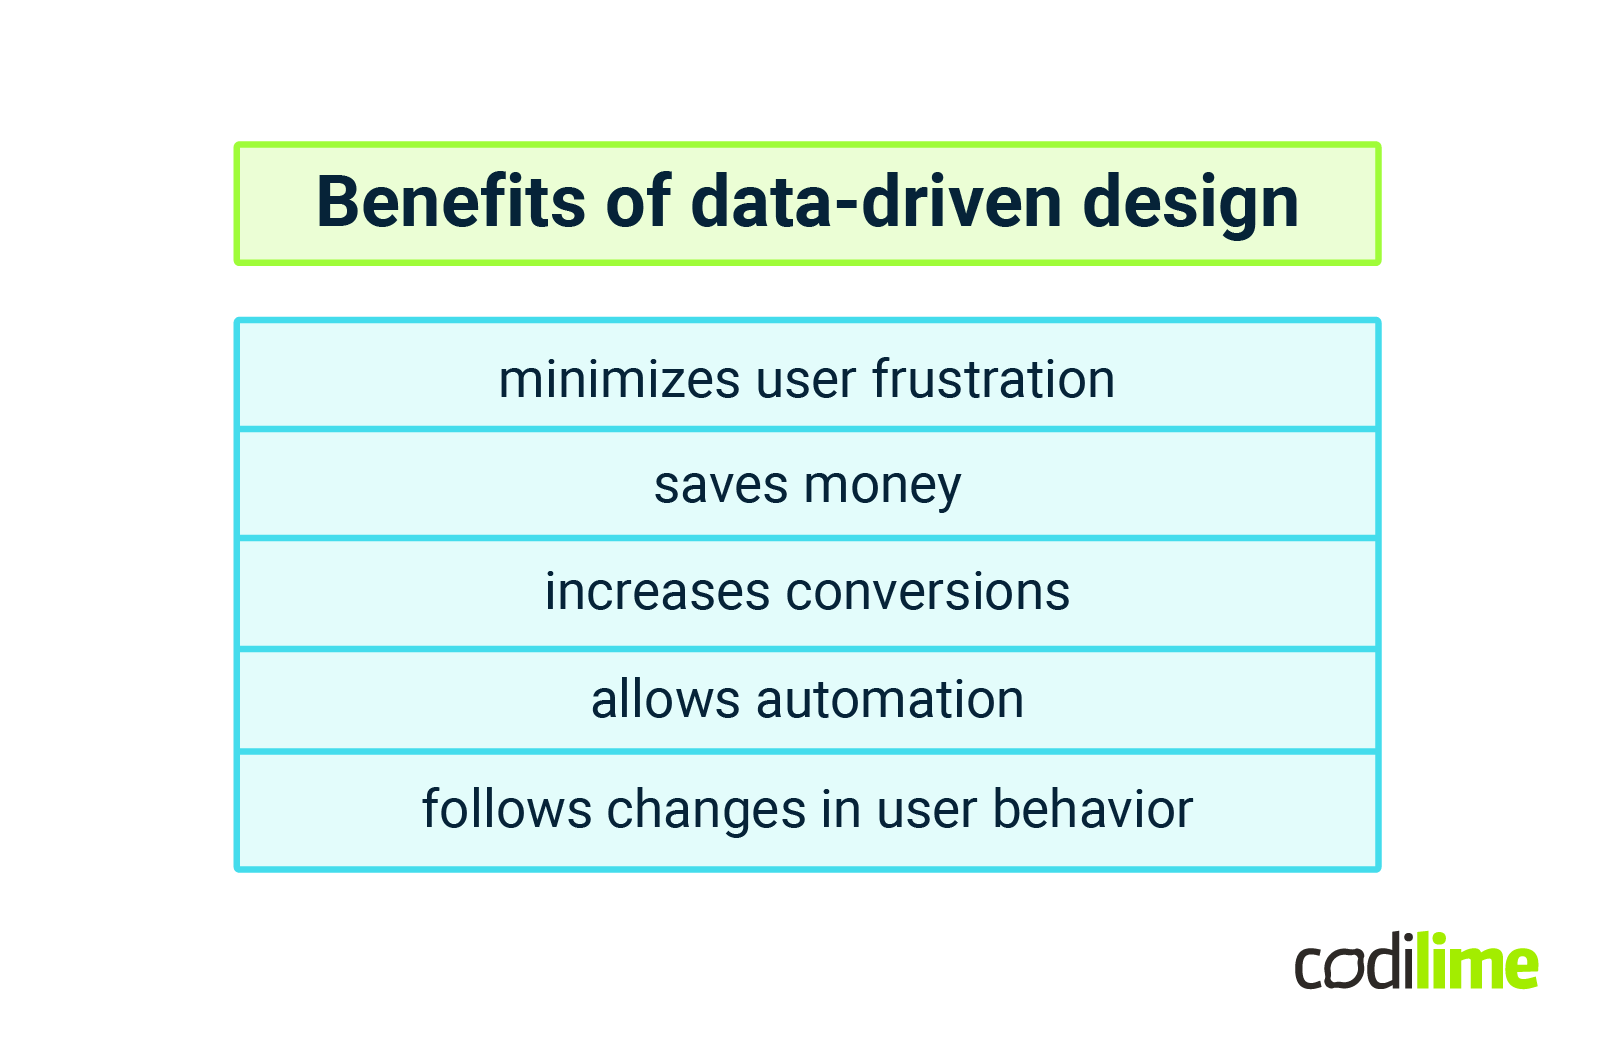
Benefits of data-driven design
Analyzing data and applying it to UX and UI design is a way designers can create a more user-friendly product, leading to more conversions. The biggest benefits of data-driven design are listed below:
- Data-driven design minimizes user frustration – it eliminates so-called pain points. The user experience is improved. The end-user is always central to the product.
- Data saves money as issues are identified more quickly. Fewer redesigns are needed.
- Data increases conversions and sales performance.
- App and web design processes can be automated – some solutions can be reused based on the data collected earlier.
- UX and UI designers can continue learning from each project. Data can be used to understand changes in user behavior. Thus, a product can change over time and its design can be adjusted accordingly.
Data-driven design process
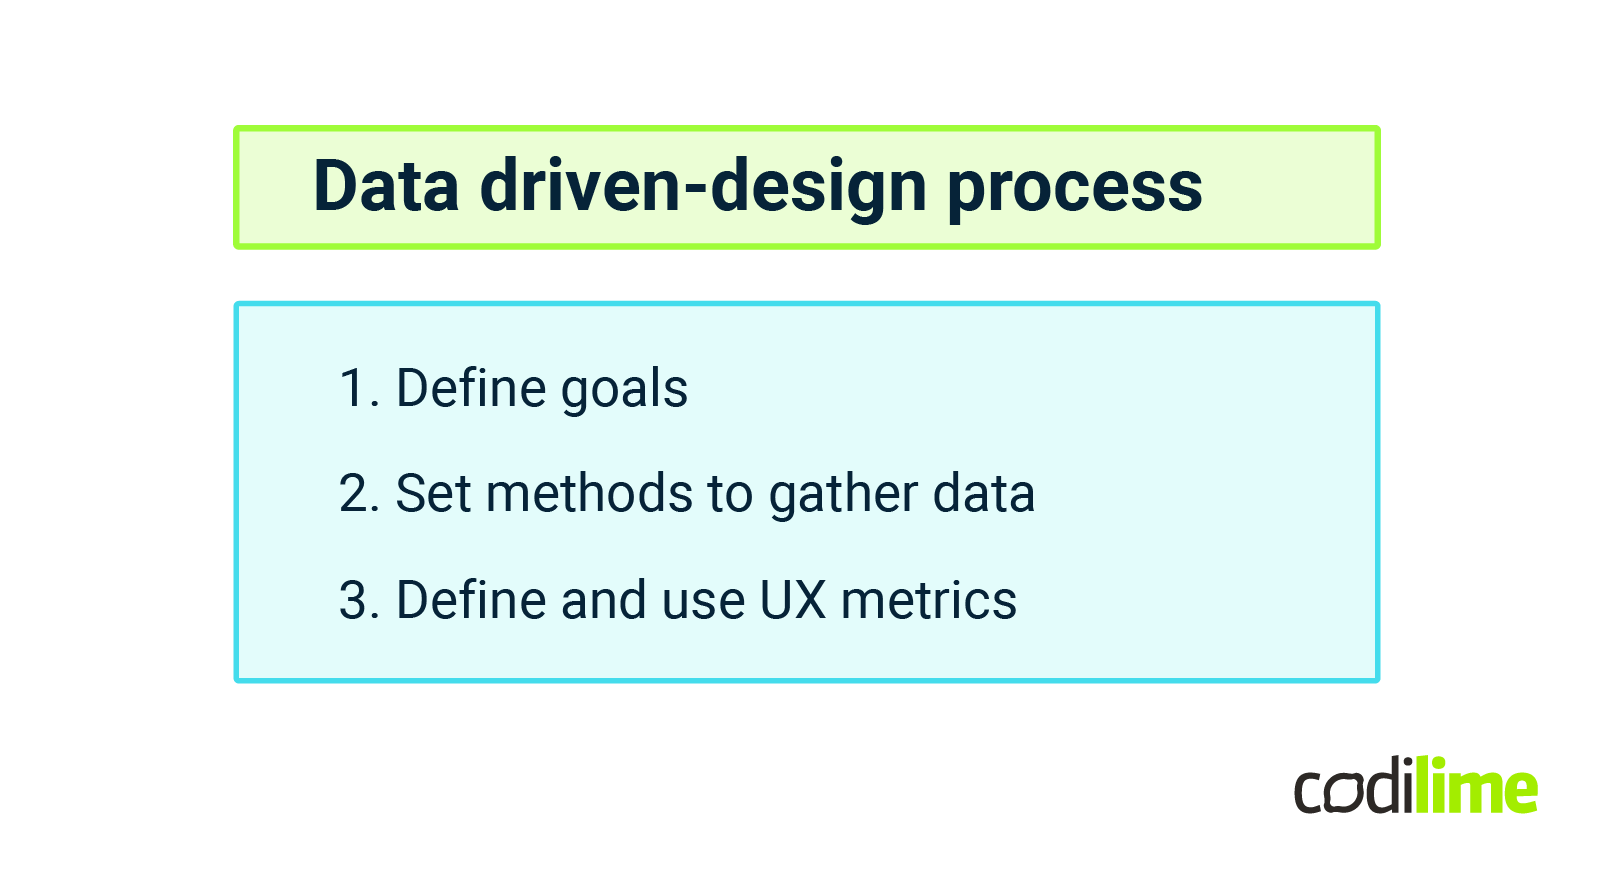
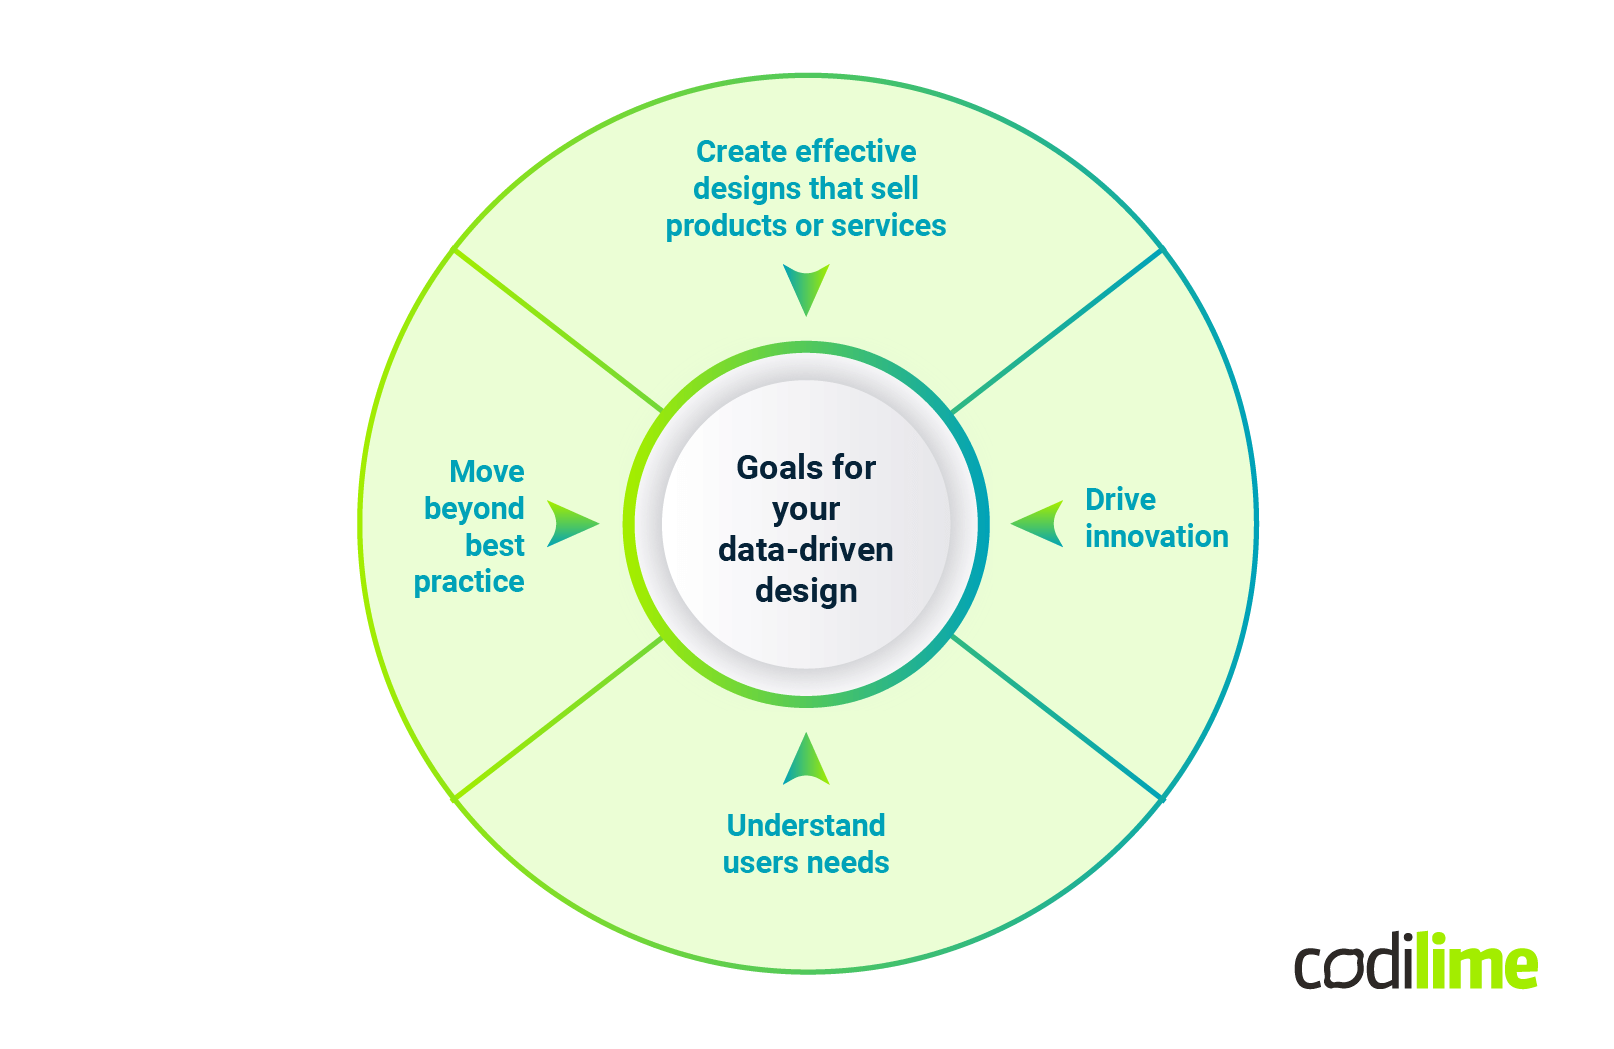
1. Define goals
It is not enough for an app or web design to be aesthetically pleasing. It should also serve a purpose. The data-driven design process is based on UX metrics ensures that every single design decision is intentional and optimizes the experience for users. At the same time, design should drive business results and set goals should be specific as possible ![]() at a particular moment. The most crucial goals of gathering data for data-driven design are:
at a particular moment. The most crucial goals of gathering data for data-driven design are:
Understand users’ needs
UI and UX designers aren’t able to predict what users want and need. They are not your actual users. However, they can bridge the gap with solid UX research, user research ![]() , and usability testing.
, and usability testing.
Create effective designs that sell products or services
If you use and analyze data correctly, you can easily improve your business outcomes. If your UX experience is intuitive, easy to navigate, and engaging, users are more likely to convert.
Drive innovation
Continuous research and user interviews helps designers meet new and current user needs, resulting in a higher conversion rate (and revenue, at the end of the day).
Move beyond best practice
Thanks to gathering relevant data and user feedback, you gain insights that are specific to your target audience to improve the UX. You can enhance the user experience from user research, user interviews, website analytics, survey results, etc ![]() .
.
2. How to successfully accomplish data-driven design
Choosing the right methods is crucial in gathering useful data. In order to make the right choice for your project, answer these important questions:
- Who are the users? What are their common behaviors?
- How do you usually communicate with the target audience? Which channels do you use most often?
- Do you have any feedback from your clients/users? What do they think about your product? What are the things they like or dislike?
- What UX metrics do you use to measure your goal? Are there any KPIs?
If you know what you want to achieve, it’s time to choose your UX research methods. There are many tracking analytics on websites or mobile apps. Also Google Analytics has built-in benchmarking tools you can use to see how your website is doing compared to the industry average. Usability testing, A/B testing, behavior flows. Now, let’s move on to the most valuable UX metrics.
However, you do not have to do this on your own—check how outsourcing UX/UI services can improve your project.
3. Define and use UX metrics
UX metrics let you measure, compare, and track the user experience on your website or mobile application. UX metrics should always have a timeframe, a UX benchmark, and a clear reason for being collected. There are two types of UX metric: quantitative behavioral metrics and qualitative attitudinal metrics ![]() . The first type focuses on how users interact with your site or app, whereas the second focuses on how users feel about your website or app.
. The first type focuses on how users interact with your site or app, whereas the second focuses on how users feel about your website or app.
Typical behavioral metrics are:
- page views,
- the time particular tasks take – usually, the shorter the time the user needs to get something done, the better,
- abandonment rate,
- average order value,
- conversion rate,
- problems and frustrations users have while using your services—this might be a number of unique problems or a number of users who encounter a particular problem.
Typical attitudinal metrics are:
- ease of use,
- credibility,
- loyalty (can be measured with, for example NPS),
- customer satisfaction—very often CSAT (Customer Satisfaction Score) and NPS (Net Promoter Score) are used,
- task performance – TPI (Task Performance Indicator),
- appearance (how users like your website/app).
How do UX designers make data-driven design decisions? They use a wide variety of tools, including session replays (user recordings), conversion rate optimization calculators, heatmaps, real-time analytics tools, web and mobile analytics tools, user behavior flow maps, A/B tests, usability tests, and many more.
Remember these are metrics for the design of the product. There is more data you can collect at different stages to improve your product and its production. For example software development metrics.
Conclusion
Very often, UX teams try to optimize the design while forgetting the broader picture. This may lead to a worse user experience and even damage to your brand image in the long term. This is why implementing data-driven design should be an informed decision, based on clear goals and expectations. Data-driven design, done right, can be a consistent way to create successful products that meet user demands and improve ROI. There is no single UX metric that can provide the highest quality of user experience so the UX metrics you choose should depend on your own company goals and what results stakeholders wish to see. The most important thing is to know what you want to measure and why.


