


In this blog post, I will describe a problem encountered while working on a project involving GPU usage in network traffic processing (knowledge of GPU programming won’t be required as it will quickly become apparent that the problem is more general and the GPU can be eliminated).
I will describe the steps that helped me in locating and fixing the problem – practical methods used for DPDK profiling and debugging. Also, I will describe some low-level internal DPDK mechanisms (e.g. packet processing, IOMMU, hugepages usage and impact) that helped in understanding the issue.
Environment Description
The application I tested is a simple single-threaded traffic forwarder written using DPDK libraries – the application reads incoming packets from one port and then forwards them to another. What is unusual is the storage device for the packet data. The packets are stored in GPU memory instead of normal CPU memory. Originally, this prepares the packets for further processing by the GPU but in this blog post we just treat the GPU as additional memory.
How can you configure something like this in DPDK?
A typical DPDK application uses hugepages allocated at the beginning of the program execution to allocate all memory. Hugepages require fewer entries in the TLB (translation lookaside buffer), which is used to cache the translation of virtual to physical addresses, which in turn provides better program performance in applications that use lots of memory operations. Mbuf pools, which are used to allocate mbufs (buffers for packets), use hugepage-based memory too.
However, DPDK provides an alternative API that allows mbuf pools to use external, user-created memory (the function is called rte_pktmbuf_pool_create_extbuf()). It can be used, for example, to create an mbuf pool that uses GPU memory – NIC instead of writing packets to CPU memory would directly write to buffers located in the GPU which would allow for faster traffic processing.
What’s also important is that network interfaces use vfio-pci as a driver. This driver allows the use of IOMMU which translates IOVA (IO virtual addresses which are like processes' virtual addresses but from a device perspective) to physical addresses. This requires additional configuration of DMA mapping when creating mbuf pools. Normally, DPDK does this configuration at program startup – it maps hugepages to devices that use IOMMU. However, when using external memory for mbuf pools we have to do it ourselves (this can be done using the following function: rte_dev_dma_map()).
Problem Description
With the first performance tests, some unusual problems arose. The tests consisted of generating traffic by TRex, sending it to the DPDK application, which in turn sent it back to TRex through a second port, without any additional processing. The traffic was unidirectional and consisted of 64-byte packets. At 10 MPPS, no problems were visible – 0 dropped packets. At 15 MPPS most packets were dropped. Interestingly, trying 10 MPPS again resulted in drops of several percent. Restarting the DPDK application resulted in a return to the initial state, in which 10 MPPS didn’t cause any drops. The full results are presented in the table below.
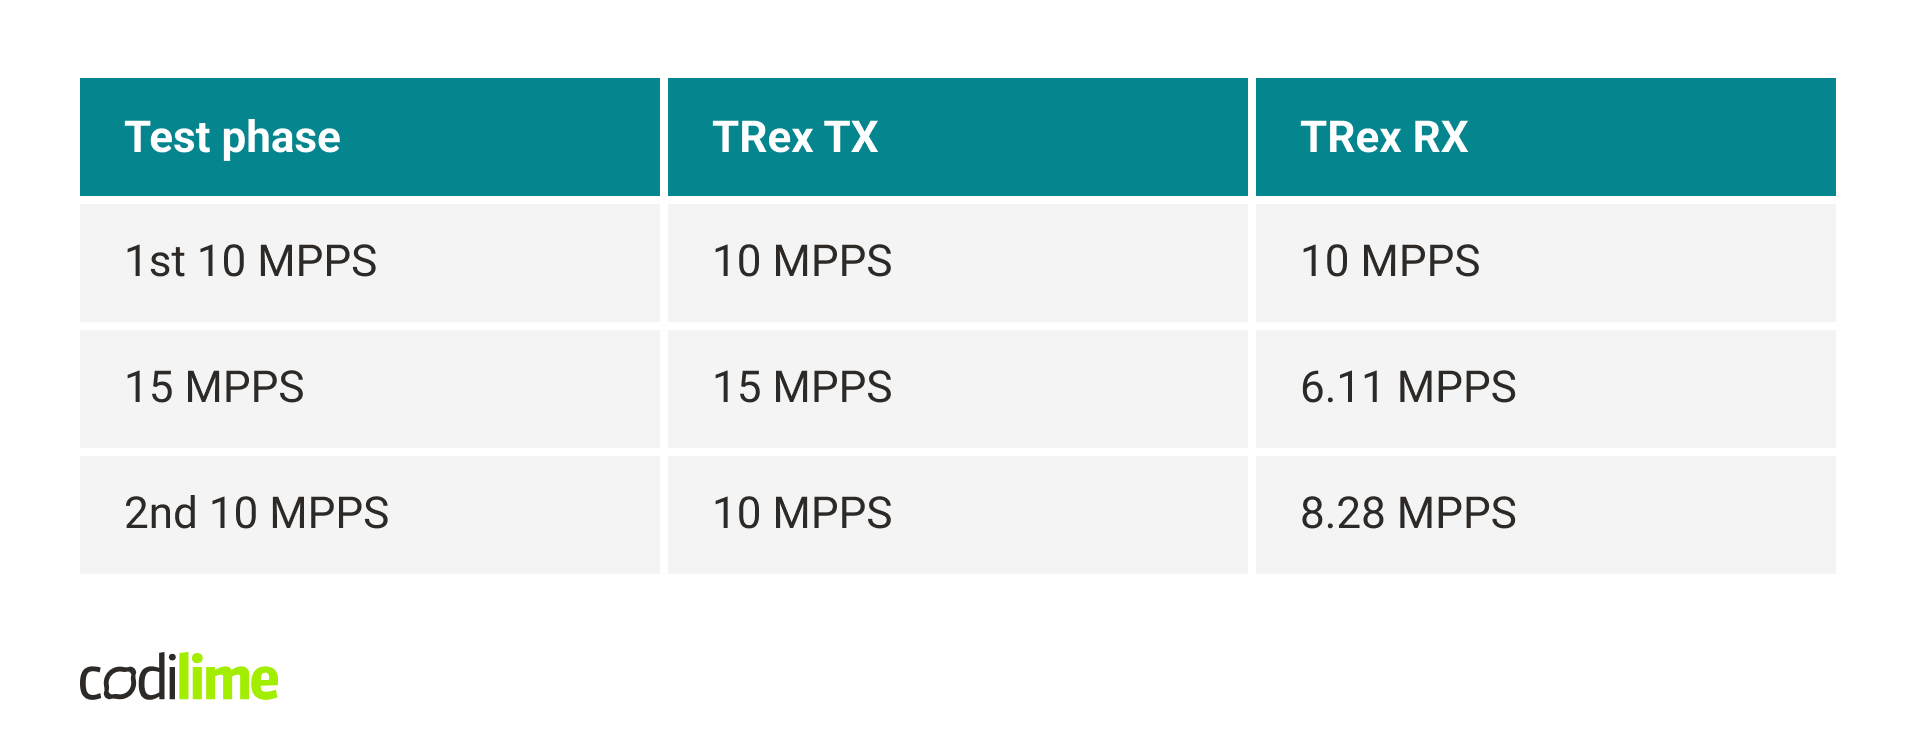
The tests were repeated in a typical environment, with mbuf pools using DPDK hugepage-based memory. In this case, similar problems didn’t occur. The application could even process 21 MPPS without any drops.

Program Performance Analysis
The first thing to check are application statistics. The most basic statistics are the number of packets received and sent by the application. This should tell us if packets were dropped before the application saw them (drops appearing on RX), or when they were forwarded to another port (drops appearing on TX).
In addition, some statistics related to the execution of the application would be helpful. A typical DPDK application executes a loop in which it polls on rte_eth_rx_burst(), which is responsible for receiving packets. This function returns immediately even when there are no packets available. This causes the applications to consume 100% of the CPU but it reduces the latency of receiving packets, which is very beneficial especially when the traffic is high. However, it is much harder to use external tools to examine whether the application is actually doing something meaningful or just spinning in a loop.
A typical solution to this is to report some statistics related to rte_eth_rx_burst() – e.g. average number of packets received by a single call to that function. Intuitively, when this number is small, it means that the application is mostly just spinning in a loop and waiting for new packets. When this number is approximately equal to the maximum number of packets that can be received by a single call to rte_eth_rx_burst(), it likely means that the traffic is too high for the application to process. More on this can be read here ![]() .
.
In this case, I decided to output the following statistics every second:
- number of RX bursts (all calls to rte_eth_rx_burst(), including those that returned 0 packets),
- number of non-zero RX bursts (calls to rte_eth_rx_burst() that returned at least one packet),
- average number of packets received by the RX burst,
- average number of packets received by the non-zero RX burst.
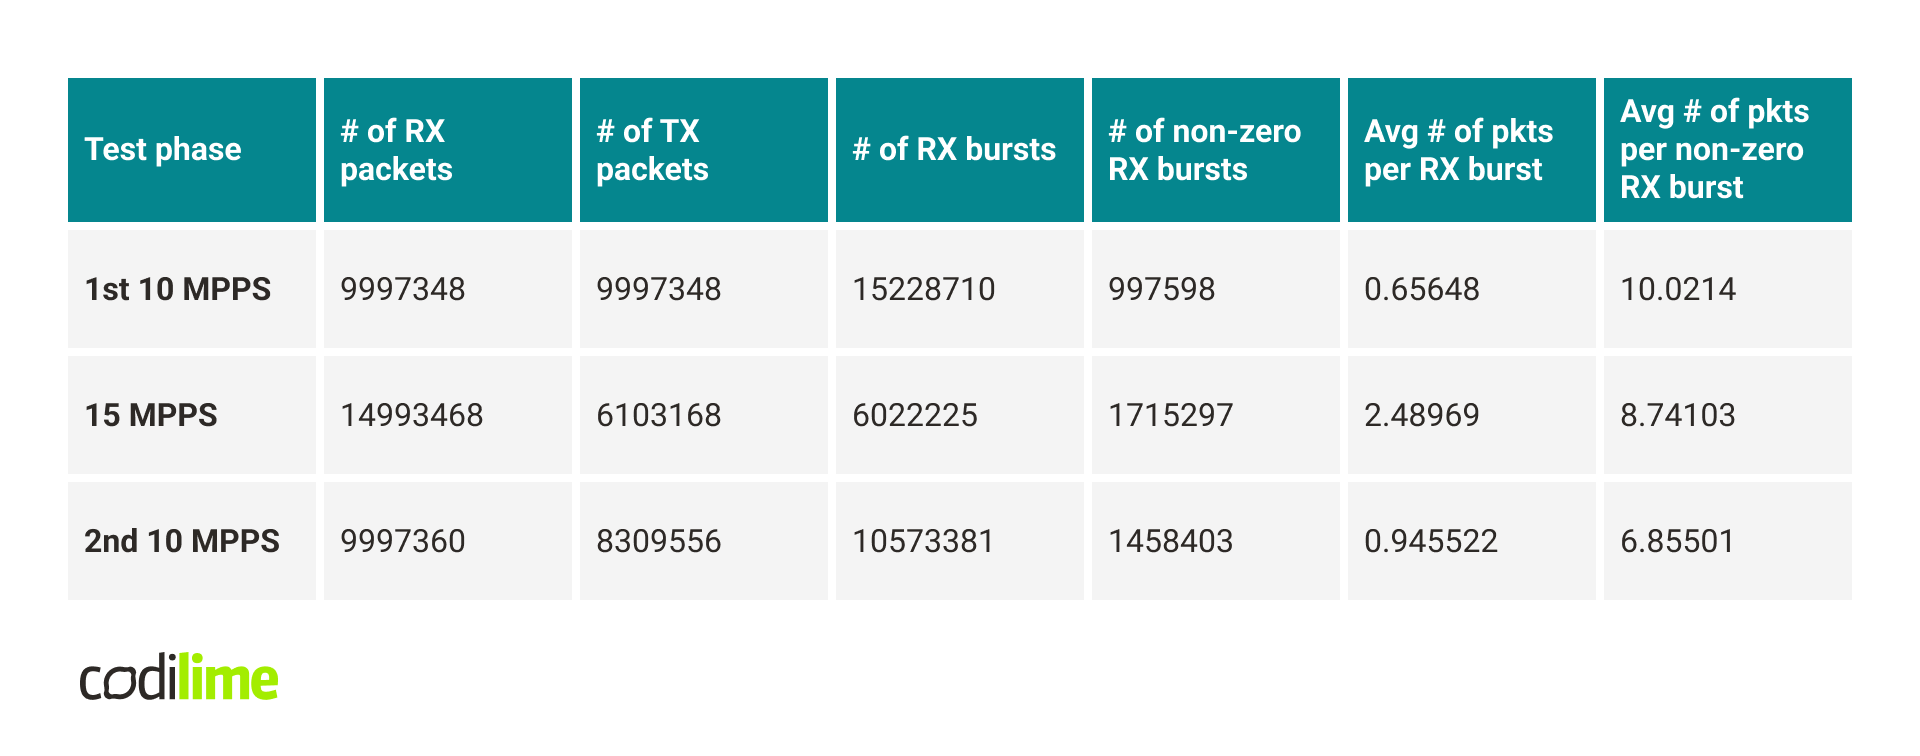
The table below presents the results of the measurements in different situations.
Several interesting conclusions can be drawn from these results. First, it turns out that drops occur when sending. What does this mean?
When starting the application, DPDK creates a number of RX and TX descriptors. These are used by DPDK to inform the NIC where buffers for storing/reading packets can be found. For example, when a packet is sent, one of the TX descriptors is filled with information about the packet (e.g. a pointer to the packet data). Later, the NIC reads the TX descriptor, finds out where the packet is, and reads the packet data. When all of this is done, the TX descriptor is freed and ready to be used for another packet. More about low-level DPDK mechanisms like this can be found here.
A packet must be assigned a TX descriptor before being sent. If no descriptors are available, DPDK cannot send this packet. This implies that the NIC has some problems while sending – it takes longer, so TX descriptors are not released fast enough and cannot be used to send subsequent packets.
Let’s now take a look at the rte_eth_rx_burst() statistics and compare the 1st and 2nd 10 MMPS test phases. We can see that the number of non-zero RX bursts increased, even though the number of received packets stayed the same. This means that for some reason the packets stopped forming into larger bursts and each non-zero RX call returned fewer packets, on average.
Another observation is that in the 2nd 10 MPPS phase we have fewer RX burst calls (including calls that didn’t receive any packet). This may be caused by the fact that more RX bursts returned a non-zero number of packets. Each call to rte_eth_rx_burst() which returned at least one packet had to pass through a slower path (which needs to, for example, fill mbuf structures) compared to situations when rte_eth_rx_burst() returned zero packets. Also, it’s worth mentioning that rte_eth_rx_burst() is much more optimized when it receives multiple packets instead of just a few.
The conclusion from these results is that after the 15 MPPS test phase, the NIC begins to struggle with receiving and sending packets, probably taking on average much more time to process a single packet.
Narrowing the problem down
The problem seems to be quite unusual in that the performance drops are not immediately visible but only appear after a certain fixed event. Additionally, it is interesting that restarting the application fixes the problem, i.e. it returns to a state in which 10 MPPS doesn’t cause any drops.
One possible approach to narrowing down the location of the problem is to restart individual components of the application, instead of the entire application. This would allow us to find the component whose restart fixes the problem.
Based on this approach and the conclusions drawn from the program statistics, it quickly became apparent that reinitializing the mbuf pool fixes the problem. This encouraged testing mbuf pool creation more extensively.
It turned out that using CPU memory, allocated by a simple malloc, causes similar problems to using GPU memory. This allows us to completely rule out the GPU as the cause of the problem.
In addition to the usual 4KiB-page memory, I also tested memory based on hugepages (but other than those used by DPDK for all allocations). It turned out that the problem does not occur in this case. With this, I learned that the problem is not related to the implementation of the function creating the mbuf pool, but the type of memory that is used underneath the pool.
Results analysis
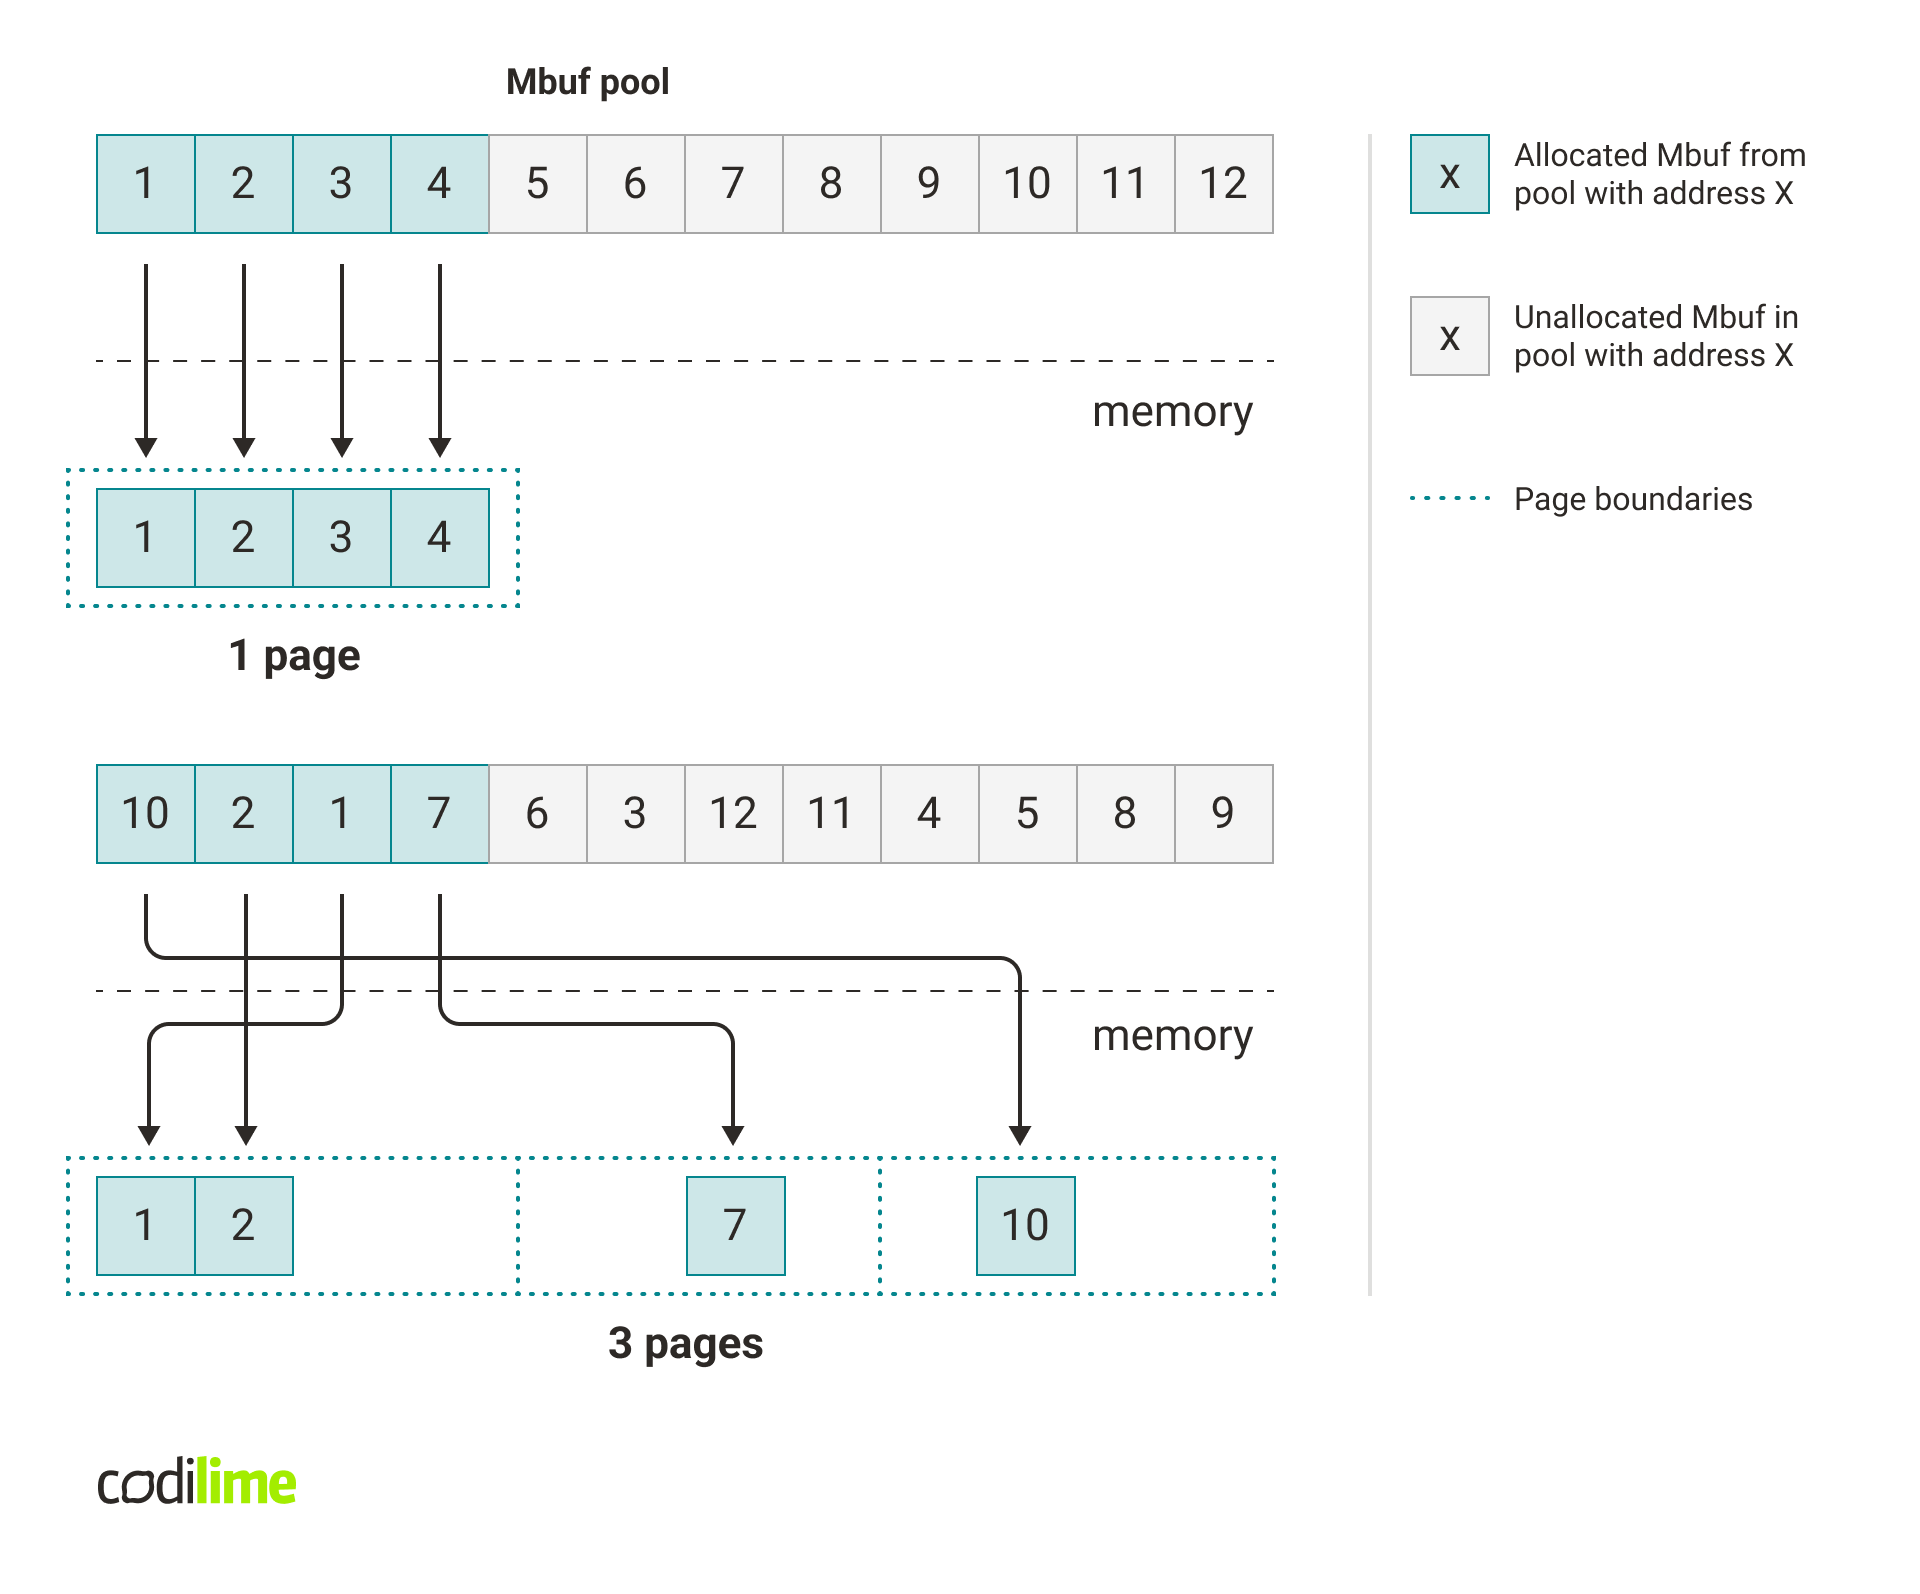
We know that the problem appears when 4KiB pages are used and doesn’t appear with hugepages. Hugepages should only improve the virtual to physical address translations. Thus, one might suspect that the problem is related to the address translation cache. Specifically, before the event, memory references were more cache-friendly and did not cause a large number of misses. However, after the event, something changed and suddenly a lot of translations were not cached and a longer path in address translation had to be used.
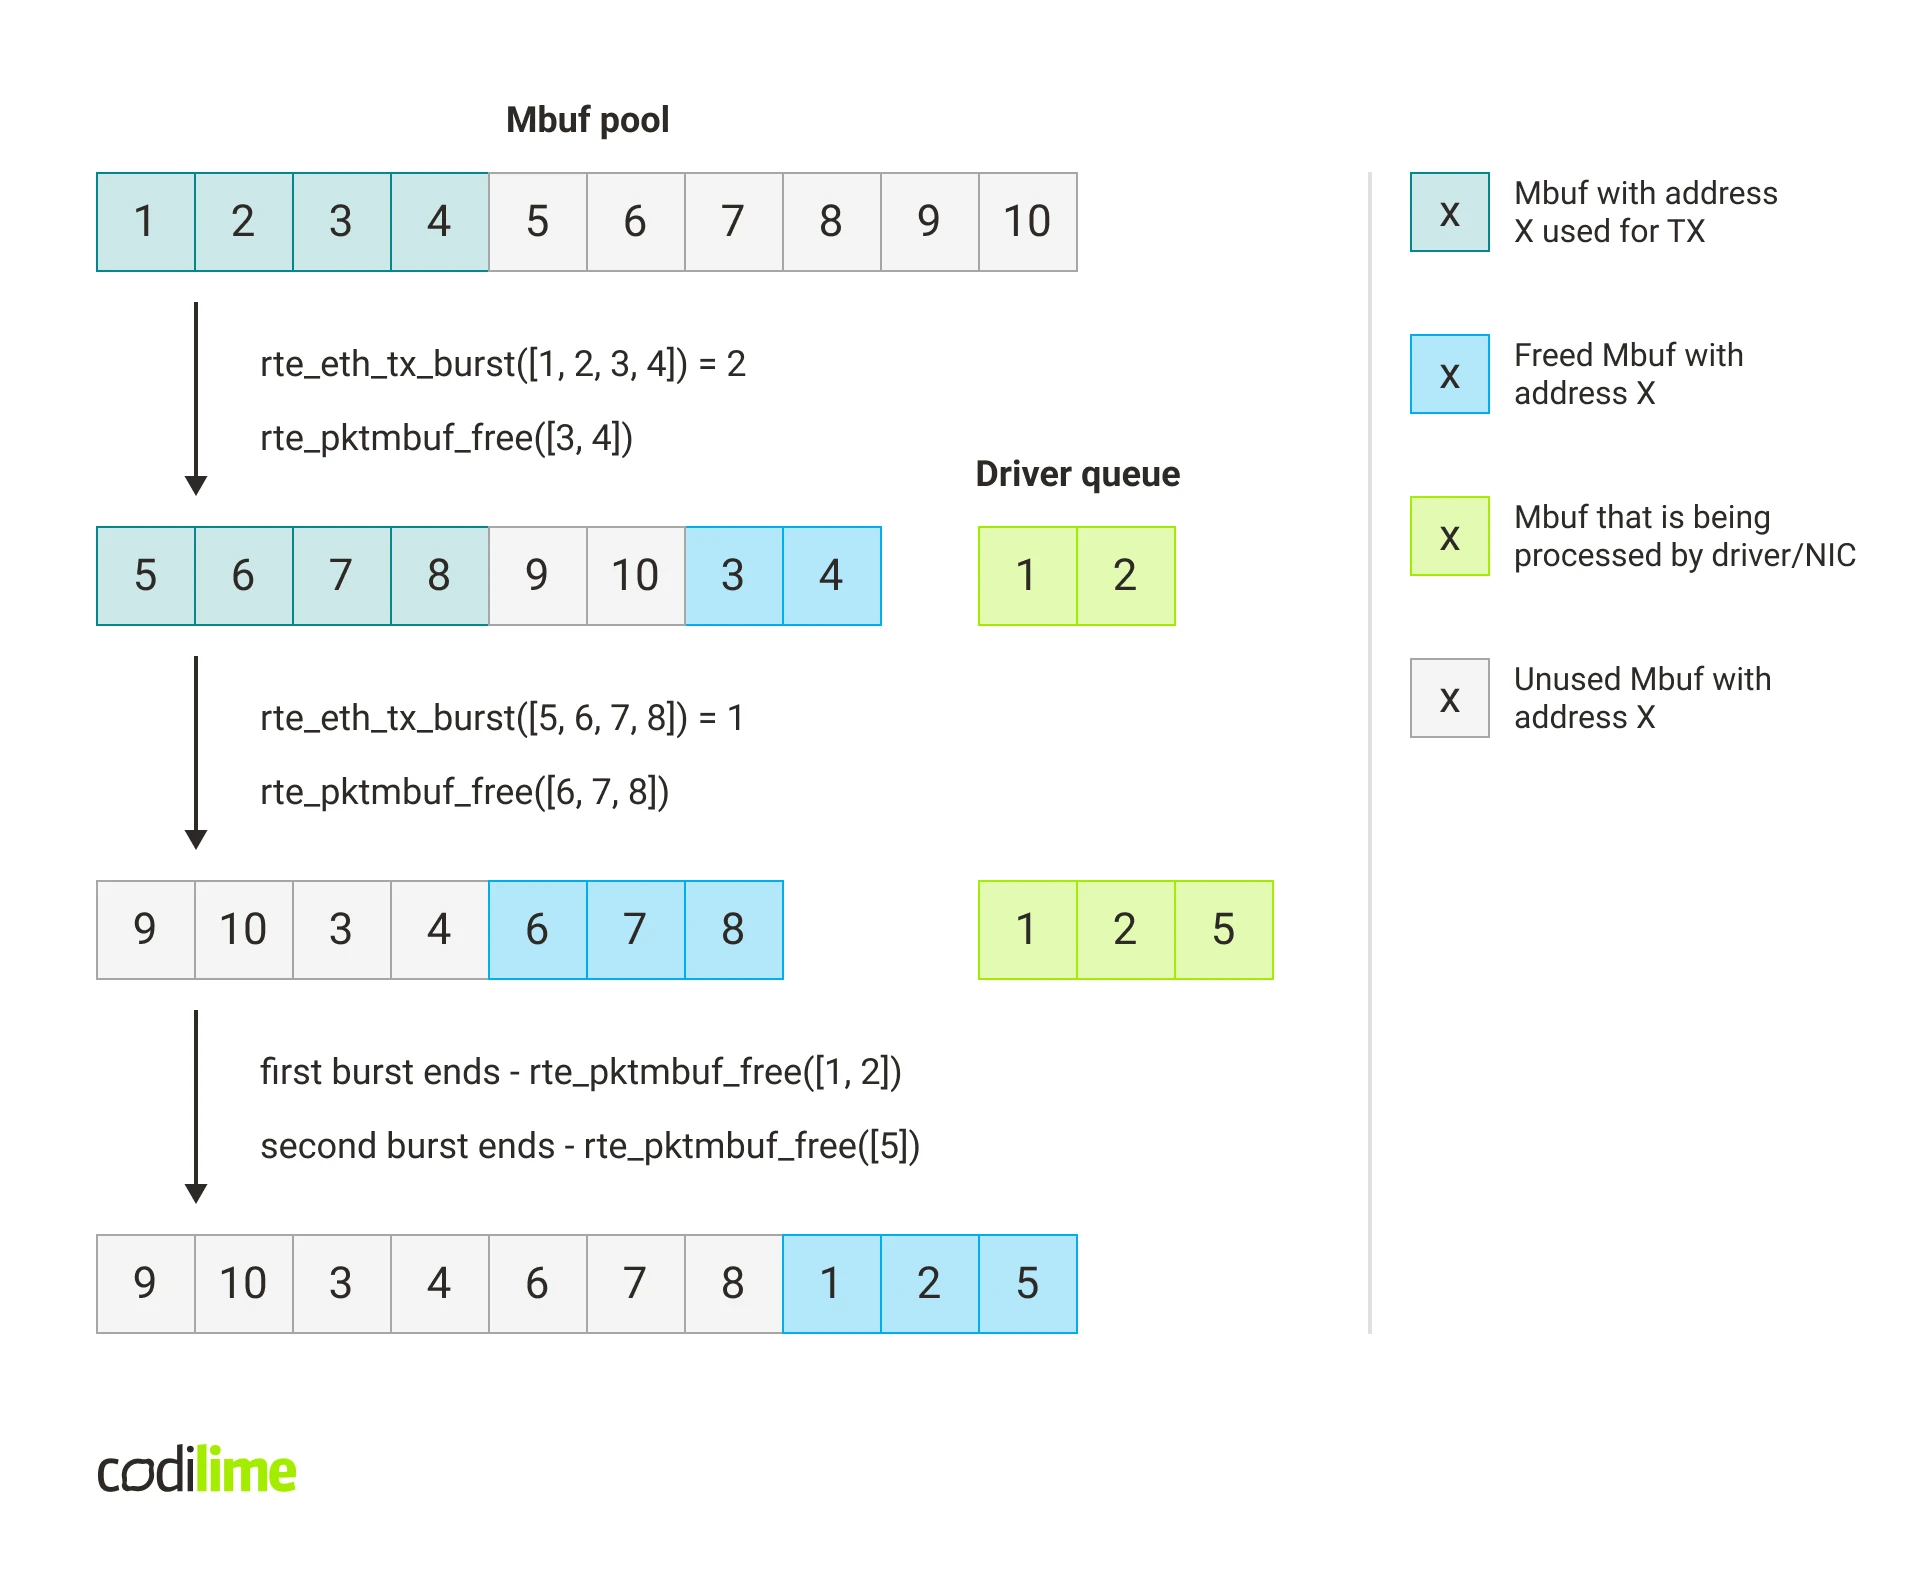
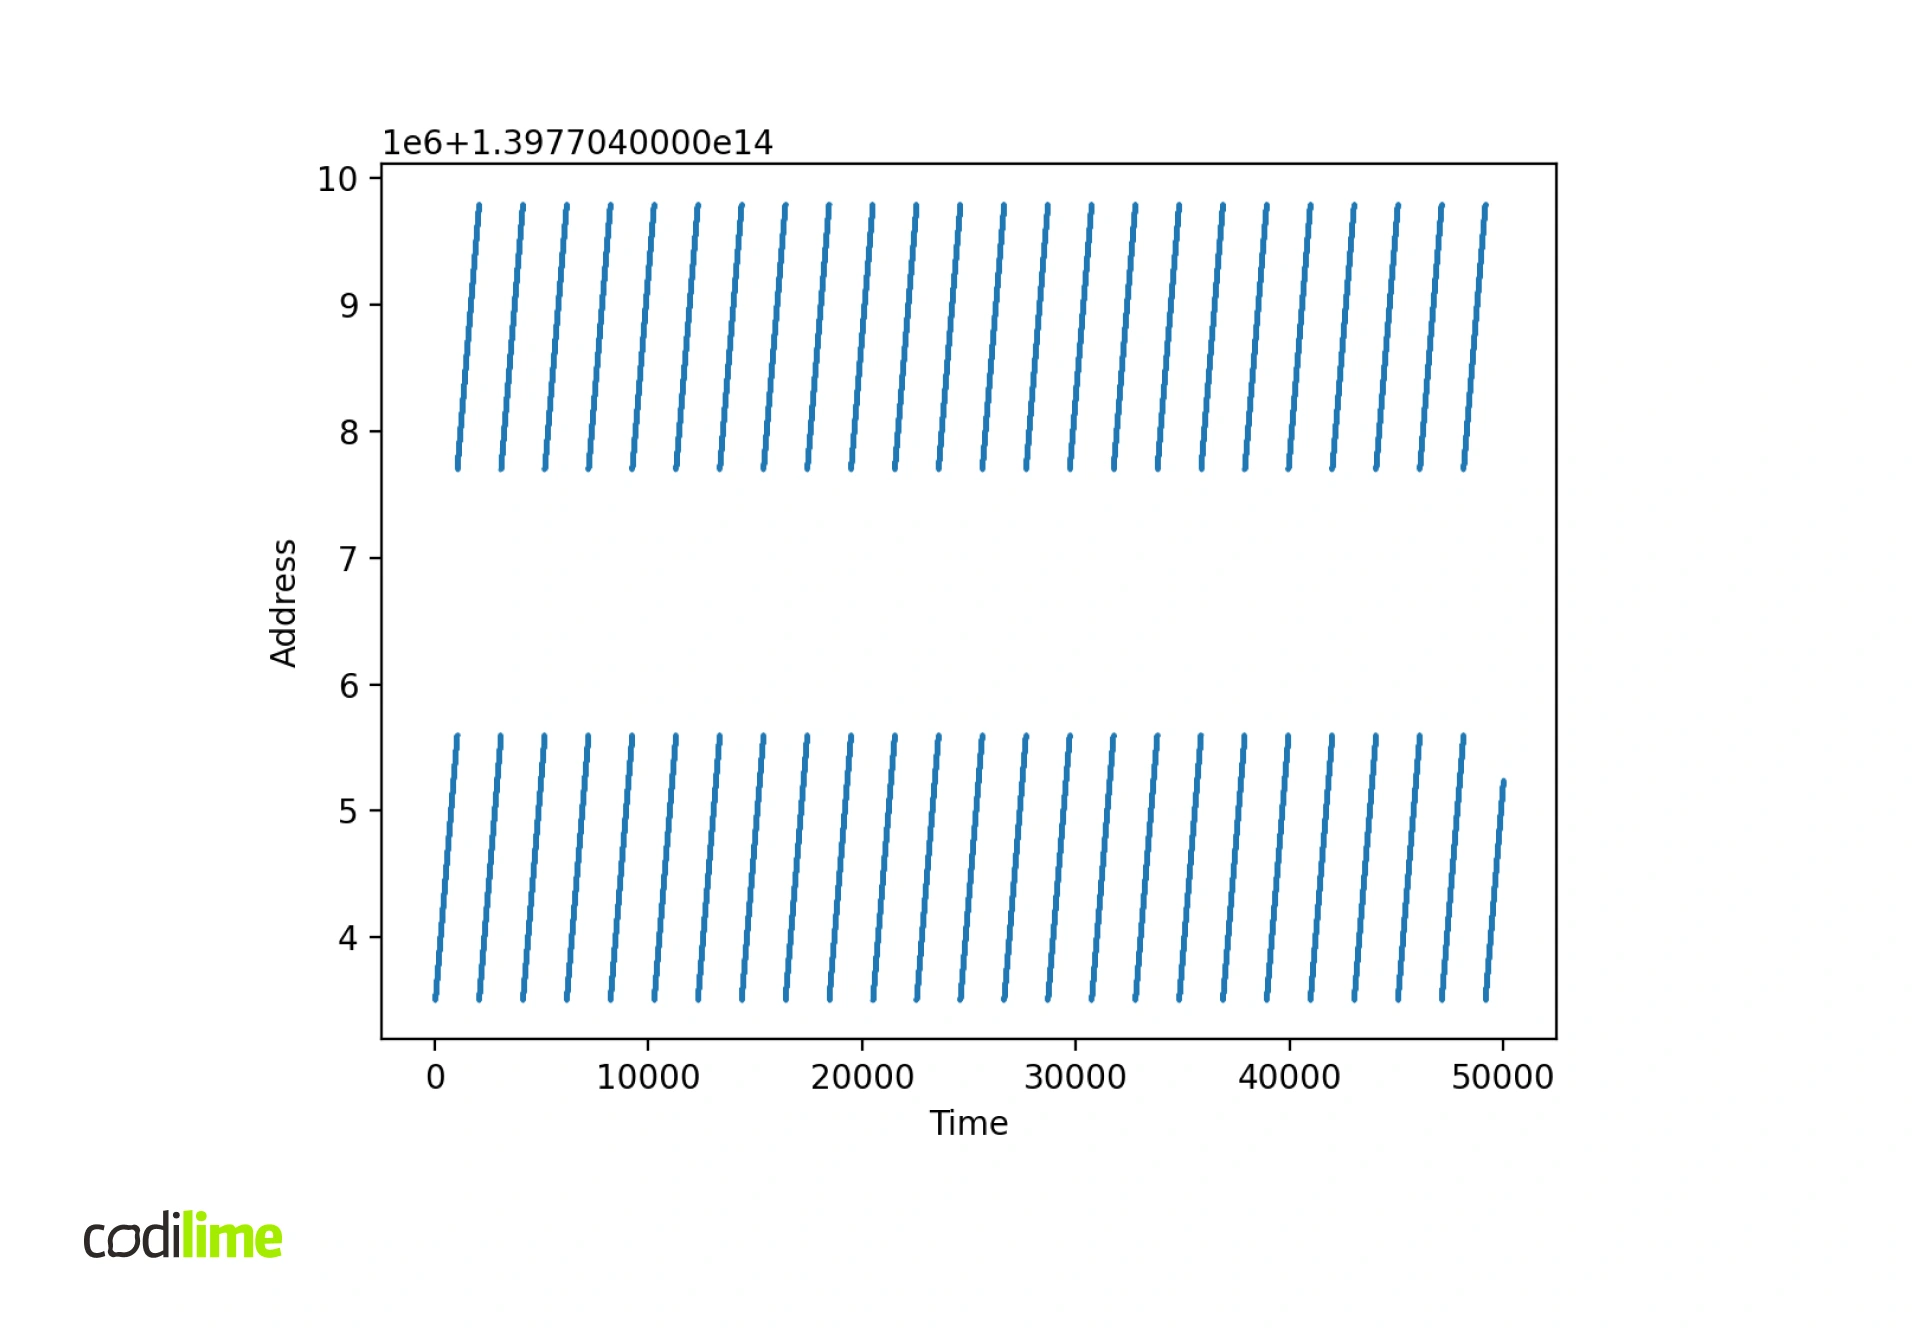
The main suspect in relation to these caching problems is sub-optimal access to the memory used for mbufs. Right after mbuf pool creation, all buffers inside are arranged in a sequential manner. Therefore when new packets arrive, consecutive buffers are used to store these packets. When there are no drops, these buffers are also consecutively freed into the mbuf pool, so buffers in the mbuf pool remain sequential. If multiple buffers fit into the same page, the same translation can be used to translate the virtual address to physical for multiple packets – this translation will be cached.
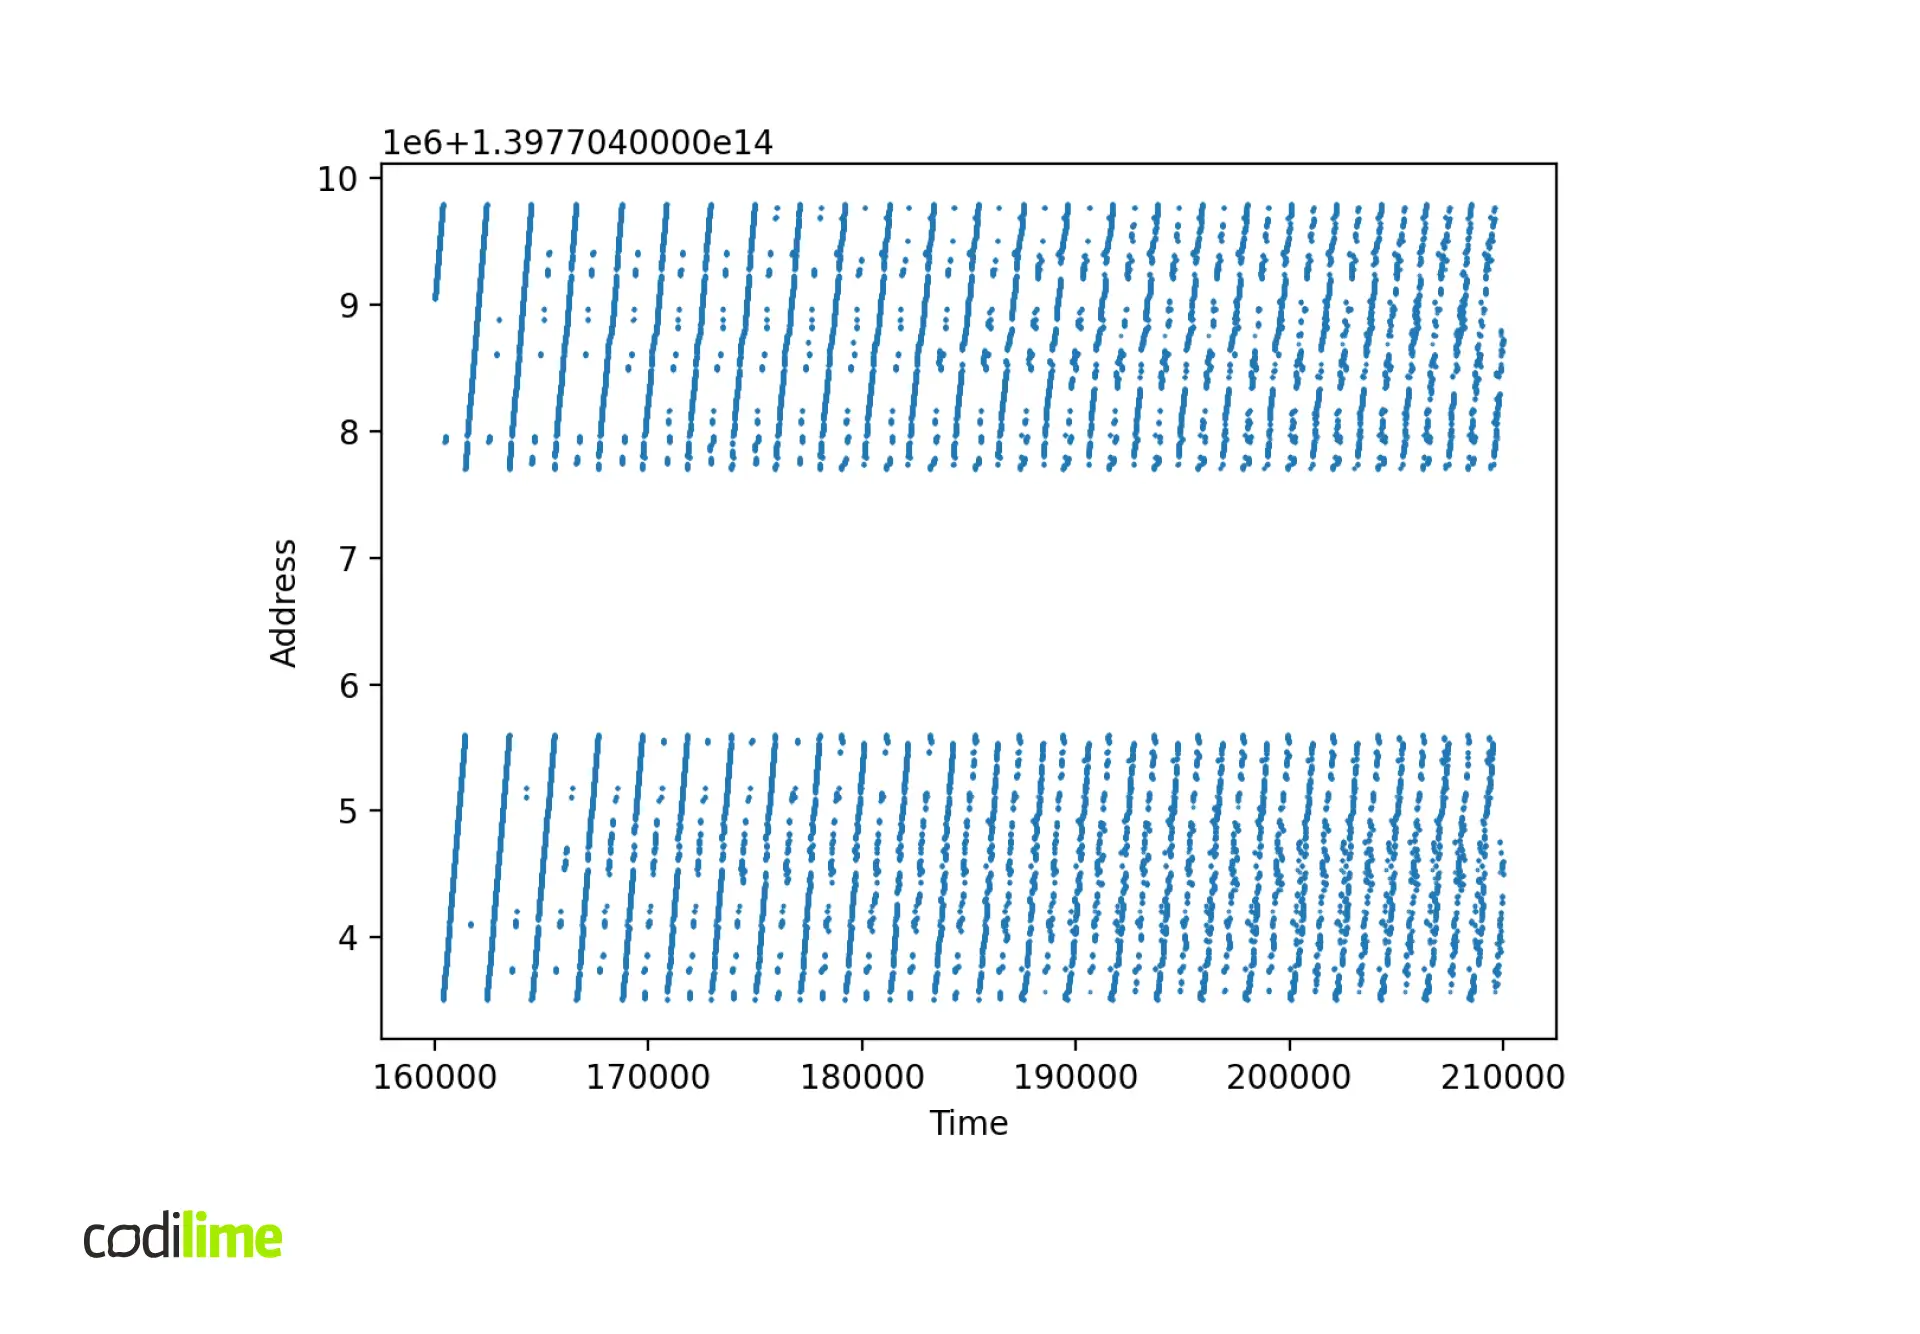
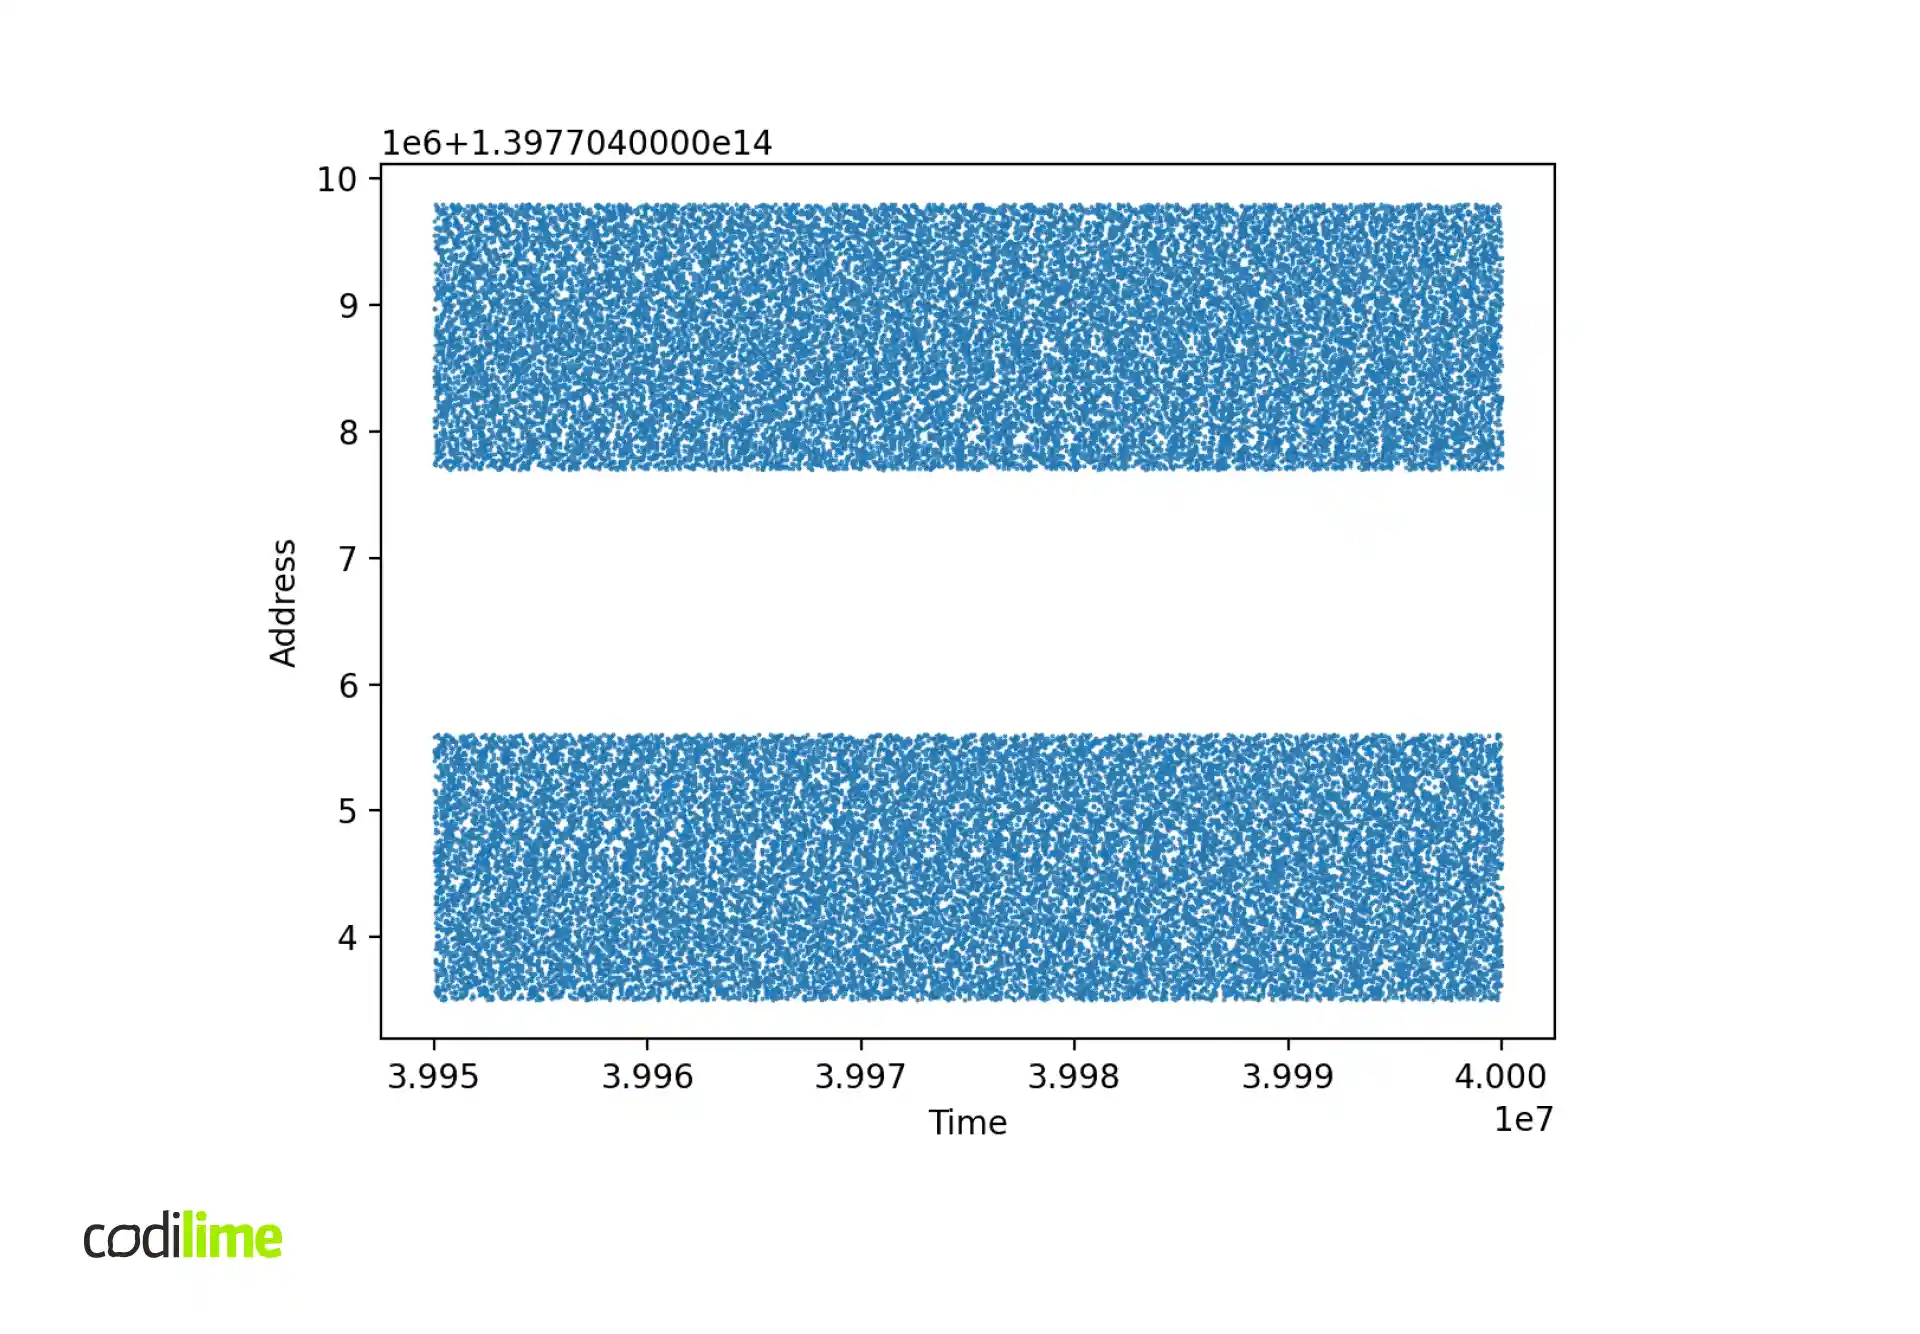
However, when drops appear, some mbufs are queued to be sent and some are immediately returned to the mbuf pool. This causes mbufs to become more scattered in the mbuf pool, which in turn affects memory access when receiving and sending packets. When the buffers are randomly scattered, then access to each buffer needs a different translation.
First, let's check if a large number of cache misses actually occur during address translation. Remember, it's not the user doing the memory references, it's the NIC, so we're using an IOMMU, which does its own translations. So we can't just check the number of TLB misses with the perf tool because it will tell us about MMU translations. Fortunately, there is a tool – pcm-iio ![]() from Intel – which can read the statistics related to IOMMU for Xeon processors. Below are the results.
from Intel – which can read the statistics related to IOMMU for Xeon processors. Below are the results.
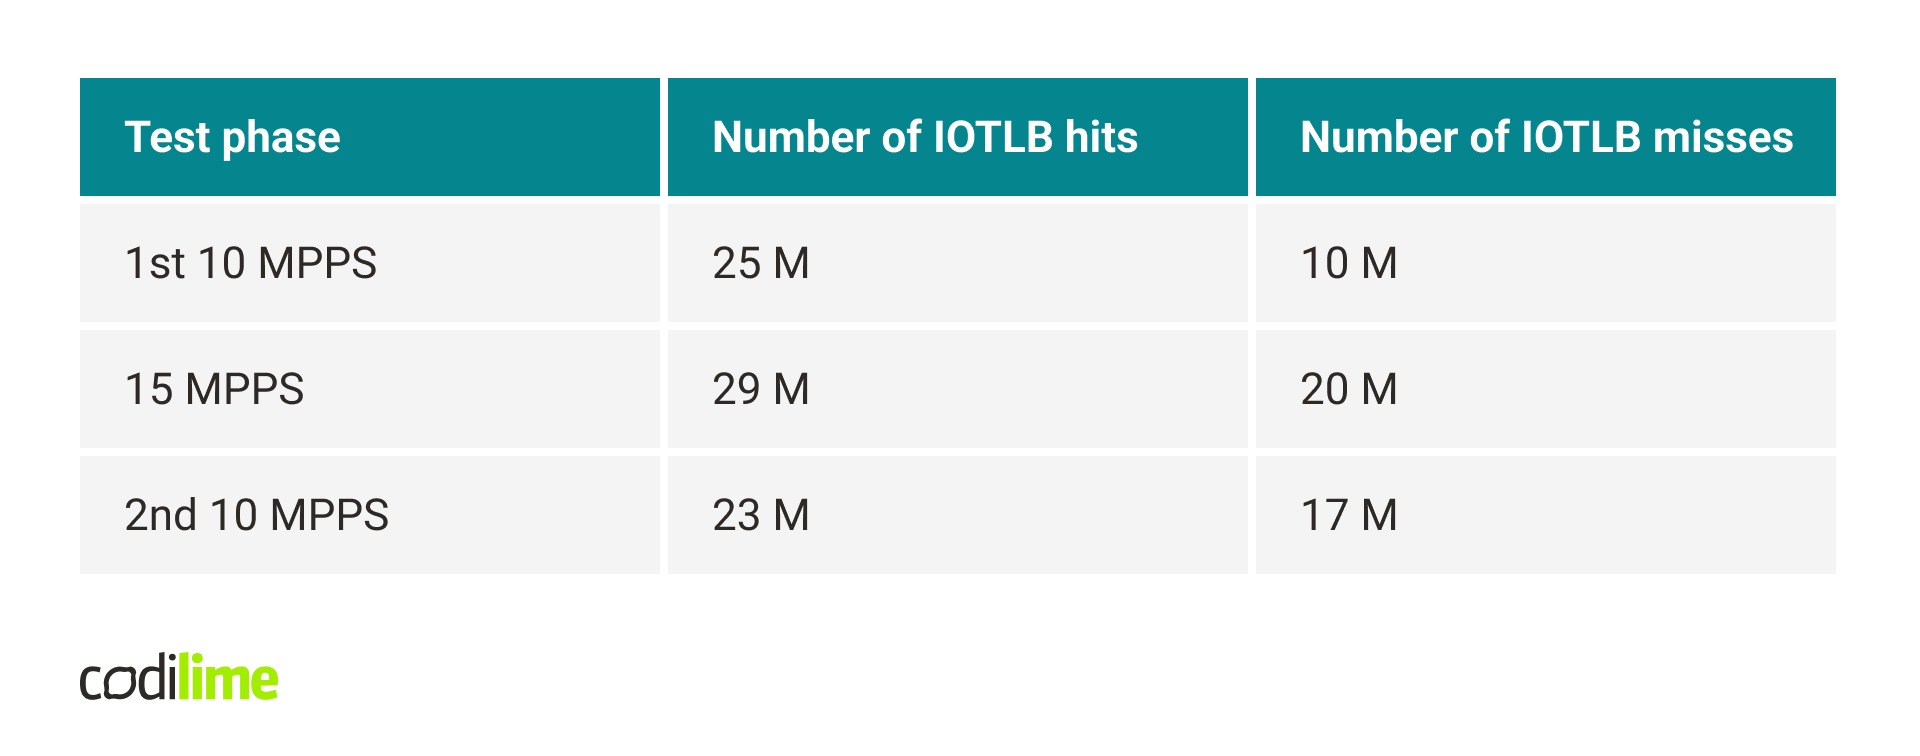
We can see that the miss count actually increased significantly after sending 15 MPPS and did not decrease to the initial value when we again started sending 10 MPPS.
The second thing to check is the distribution of packet buffer addresses at runtime.
Solutions and workarounds
There are several solutions to this problem, each unfortunately has some drawbacks.
The first solution is to ensure that the buffers in the mbuf pools are always sequentially arranged with respect to addresses. This can be achieved by not allowing drops. Instead of calling a TX burst once and returning the rest of the packets to the pool, one can instead call a TX burst in a loop until all packets have been sent. This, of course, is not always an acceptable solution – it can cause spikes in latency because you may have to wait a while for enough TX descriptors to be available.
Of course, the problem can be solved by using hugepages – these are rarely evicted from IOTLB, so translations are cached most of the time. However, this is not possible if you want to use a non-standard type of memory, e.g. GPU memory, as in my case.
Another solution is to simply resign from IOMMU and use physical page addresses. Of course not using IOMMU has its disadvantages, such as lack of isolation and immunity to invalid devices.
On the positive side, it turns out that performance degradation is dependent on the server used. For example, the server I tested on was very sensitive to random memory access, but when testing the same application on another, much more powerful machine, the problem was practically unnoticeable. Still, when the first drops occurred, the number of IOTLB misses increased, but it was not so high as to significantly affect the performance results.
Summary
In this blog post, I’ve presented how various mechanisms used in DPDK (such as mbuf pool and IOMMU) work. Apart from that, on the example of receiving and sending packets, I showed how using huge pages can impact the performance.
I've also shown techniques that can be used to debug applications written in DPDK. These types of techniques and knowledge of how DPDK works inside allowed me to locate the problem described in the blog post.
Knowing how DPDK works underneath may not always be necessary when you are just writing an application and are lucky enough to avoid all possible problems. But unfortunately, problems do appear and knowing how something works inside can be very helpful in fixing them.


